Fig. 2
Download original image
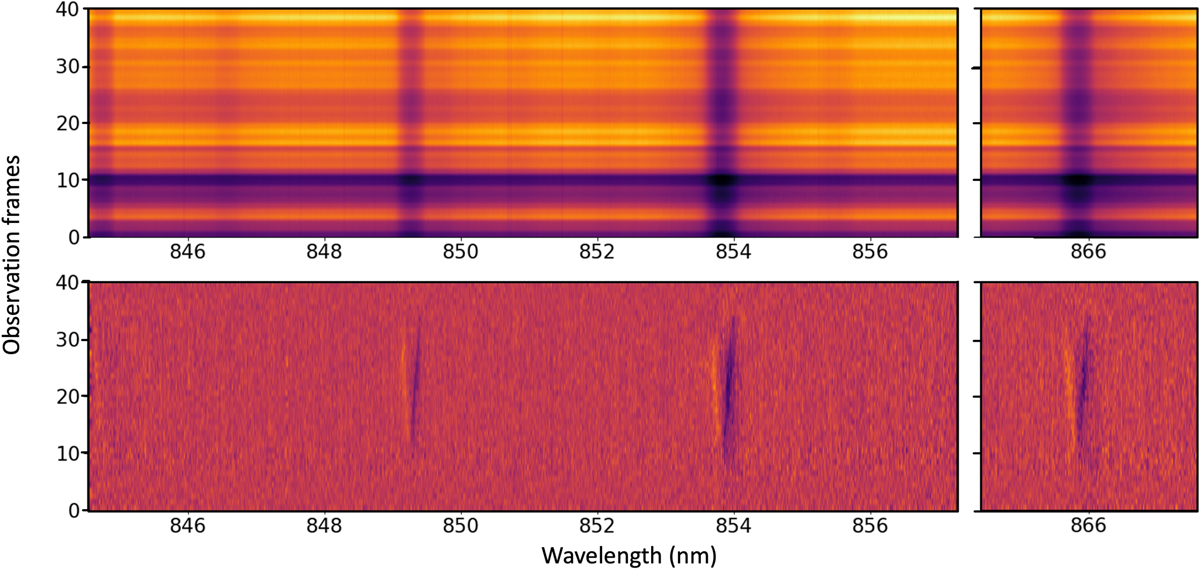
Correction of stellar and telluric signals. Top panel: raw data of two orders of MAROON-X red detector between 845 and 867 nm. Three strong stellar lines corresponding to the Ca+ triplet are observed around 849, 854, and 866 nm. Bottom panel: residuals obtained after correction with out-of-transit data. The dark signal here is the planetary Ca+ absorption lines, while the yellow signal is the Doppler shadow discussed in Sect. 3.4 that is caused by the Rossiter-McLaughlin effect.
Current usage metrics show cumulative count of Article Views (full-text article views including HTML views, PDF and ePub downloads, according to the available data) and Abstracts Views on Vision4Press platform.
Data correspond to usage on the plateform after 2015. The current usage metrics is available 48-96 hours after online publication and is updated daily on week days.
Initial download of the metrics may take a while.