Open Access
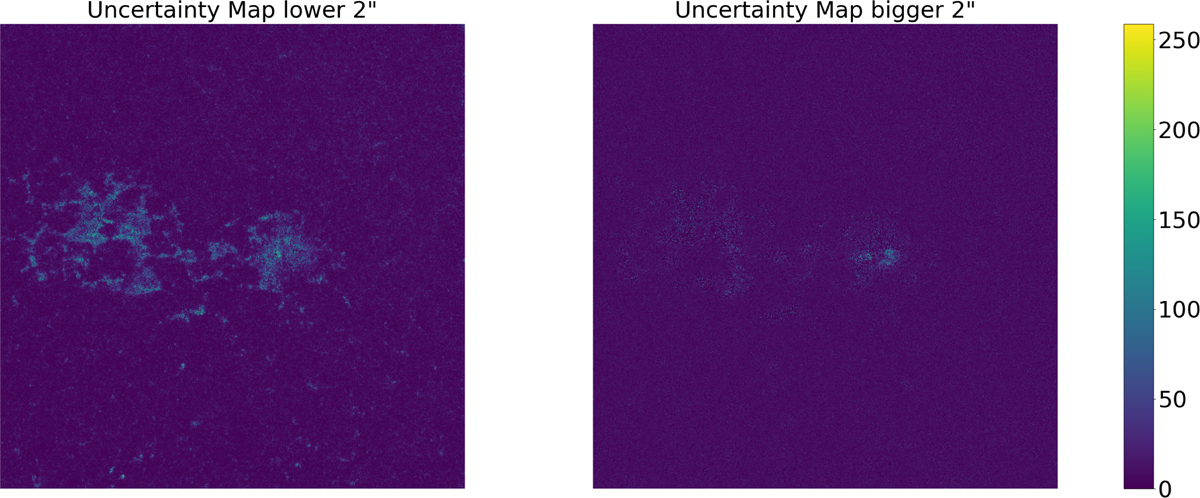
Fig. 12
Download original image
Comparison of the uncertainty maps of the features lower than 2′′ and larger than 2′′ obtained with the application of the Butterworth high-pass filter (Butterworth 1930) to the uncertainty map in Figure 11. The values on the colourbar are expressed in G.
Current usage metrics show cumulative count of Article Views (full-text article views including HTML views, PDF and ePub downloads, according to the available data) and Abstracts Views on Vision4Press platform.
Data correspond to usage on the plateform after 2015. The current usage metrics is available 48-96 hours after online publication and is updated daily on week days.
Initial download of the metrics may take a while.