Fig. 10
Download original image
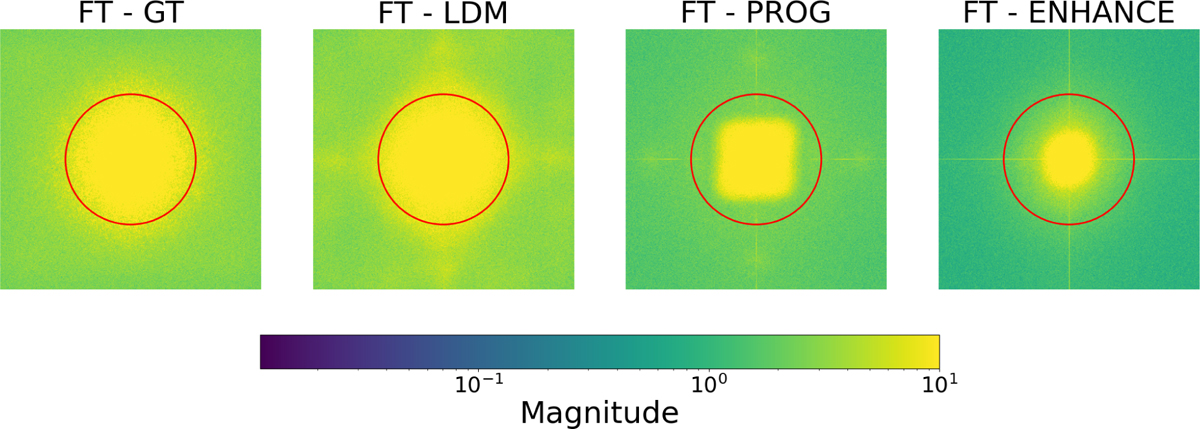
Images representing the amplitude of the Fourier transform of the ground truth image (FT – GT), and of the predictions obtained with our latent diffusion model (FT – LDM), with the progressive model (FT – PROG), and with the enhance model (FT – ENHANCE). The red circles indicate the Fourier frequencies corresponding to a spatial resolution of 2′′. This visualization highlights how each model predicts or blurs high-frequency features, which are crucial for capturing fine details.
Current usage metrics show cumulative count of Article Views (full-text article views including HTML views, PDF and ePub downloads, according to the available data) and Abstracts Views on Vision4Press platform.
Data correspond to usage on the plateform after 2015. The current usage metrics is available 48-96 hours after online publication and is updated daily on week days.
Initial download of the metrics may take a while.