Fig. 3
Download original image
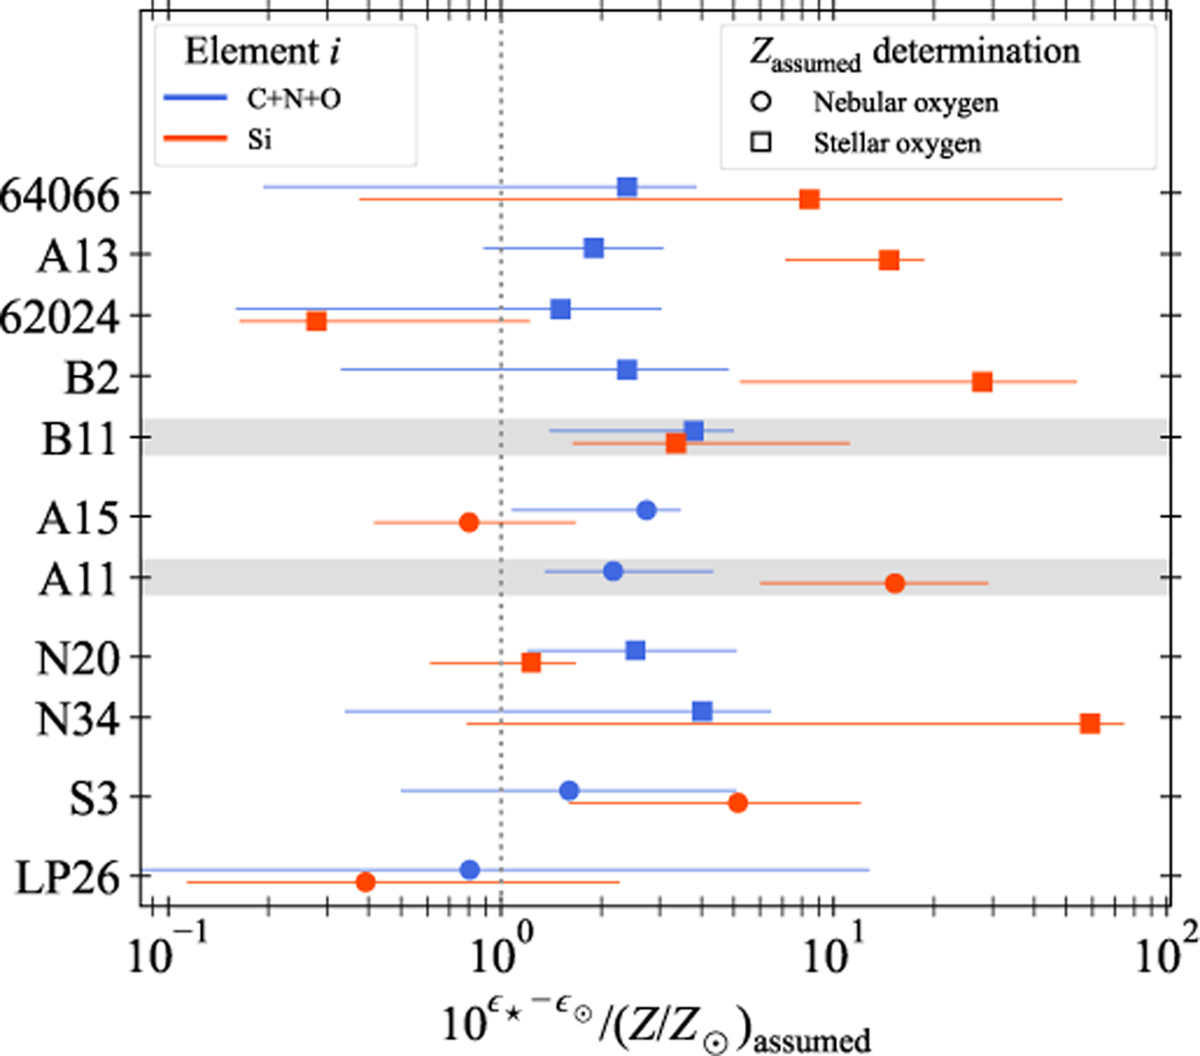
Photospheric abundance determinations of C+N+O (blue) and Si (red) for each star as a fraction of solar compared to the adopted host galaxy metallicity, Z, from Table 2. Data points indicate whether the host galaxy metallicity Z was determined from nebular emission (circles) or through spectroscopic analysis of supergiants (squares). The vertical dotted line represents equality between our abundance determination and the solar value scaled to the adopted metallicity of the host galaxy. The troublesome runs of A11 and B11 are highlighted in grey.
Current usage metrics show cumulative count of Article Views (full-text article views including HTML views, PDF and ePub downloads, according to the available data) and Abstracts Views on Vision4Press platform.
Data correspond to usage on the plateform after 2015. The current usage metrics is available 48-96 hours after online publication and is updated daily on week days.
Initial download of the metrics may take a while.