Fig. 2
Download original image
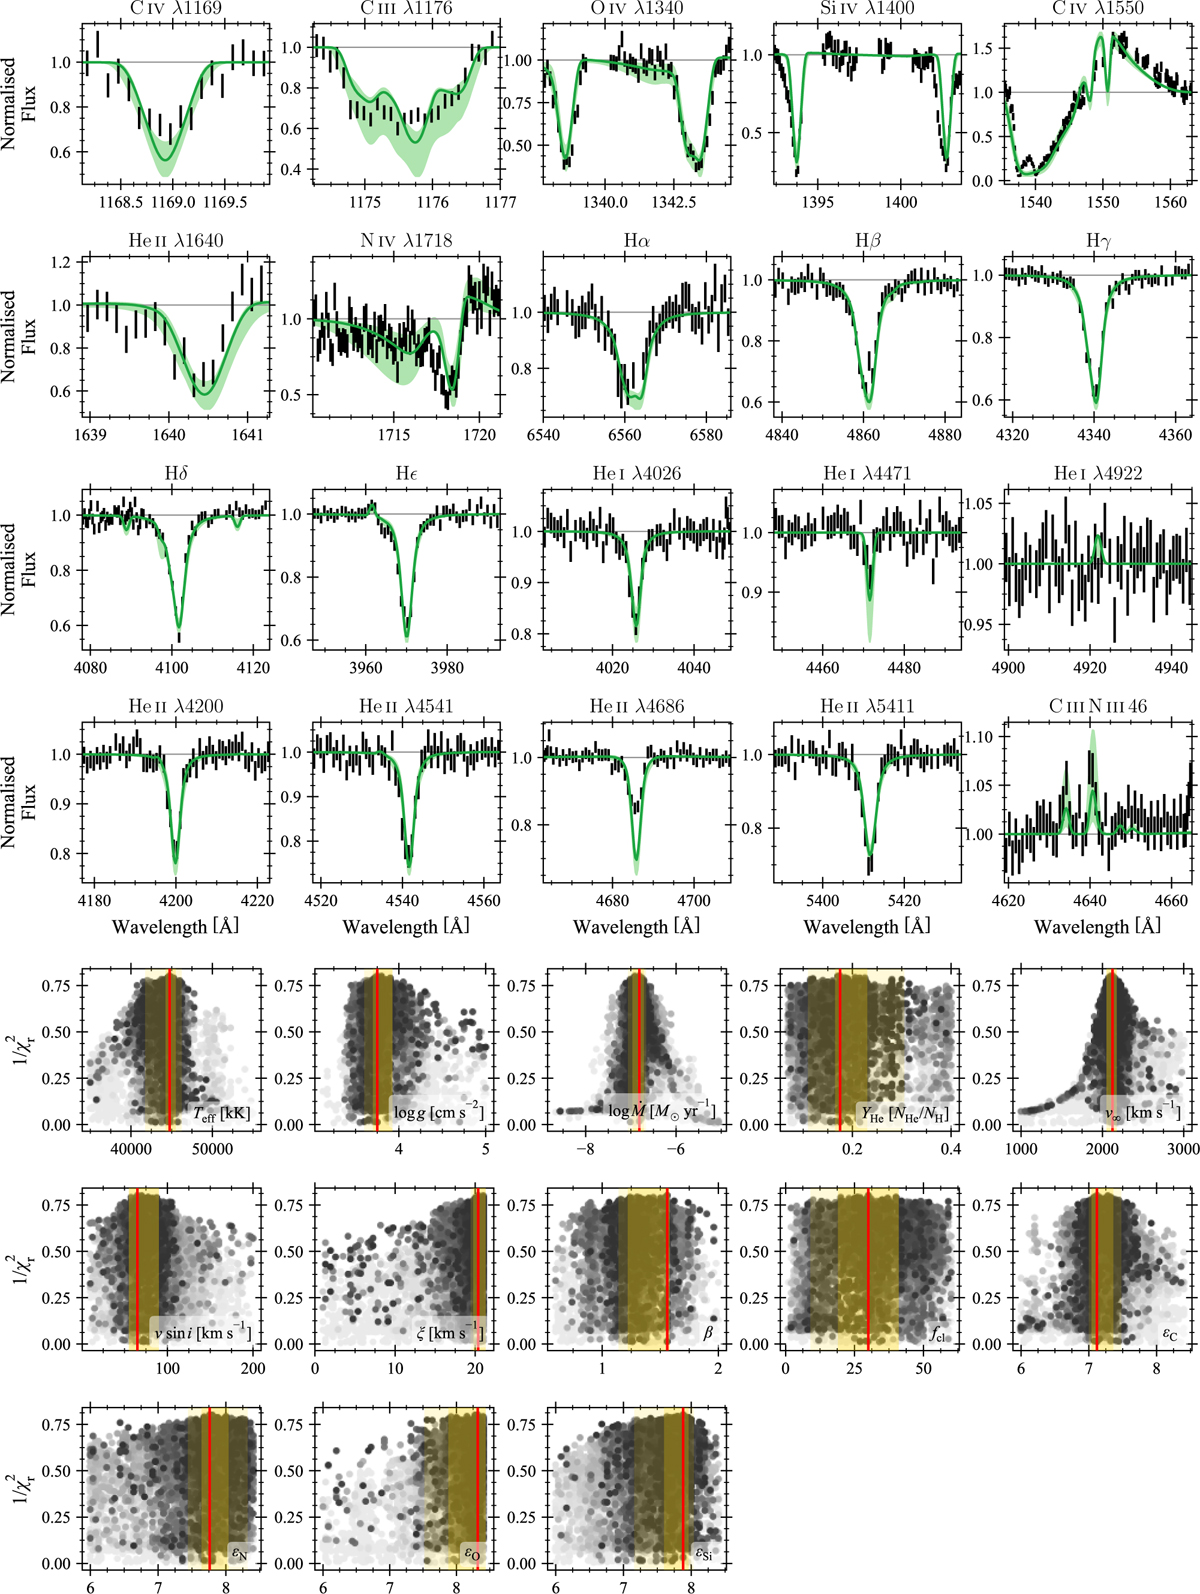
KIWI-GA fit of A13. Top: best-fitting FASTWIND model (solid green line) and 1σ uncertainties (shaded green region) plotted on top of the observed spectrum (black vertical bars representing uncertainties; rebinned for clarity). Bottom: fitness plots for each parameter where darker coloured points represent models of later generations. The solid red line is the best-fit value, and darker and lighter yellow shaded regions represent 1- and 2σ uncertainty regions, respectively.
Current usage metrics show cumulative count of Article Views (full-text article views including HTML views, PDF and ePub downloads, according to the available data) and Abstracts Views on Vision4Press platform.
Data correspond to usage on the plateform after 2015. The current usage metrics is available 48-96 hours after online publication and is updated daily on week days.
Initial download of the metrics may take a while.