Fig. 12
Download original image
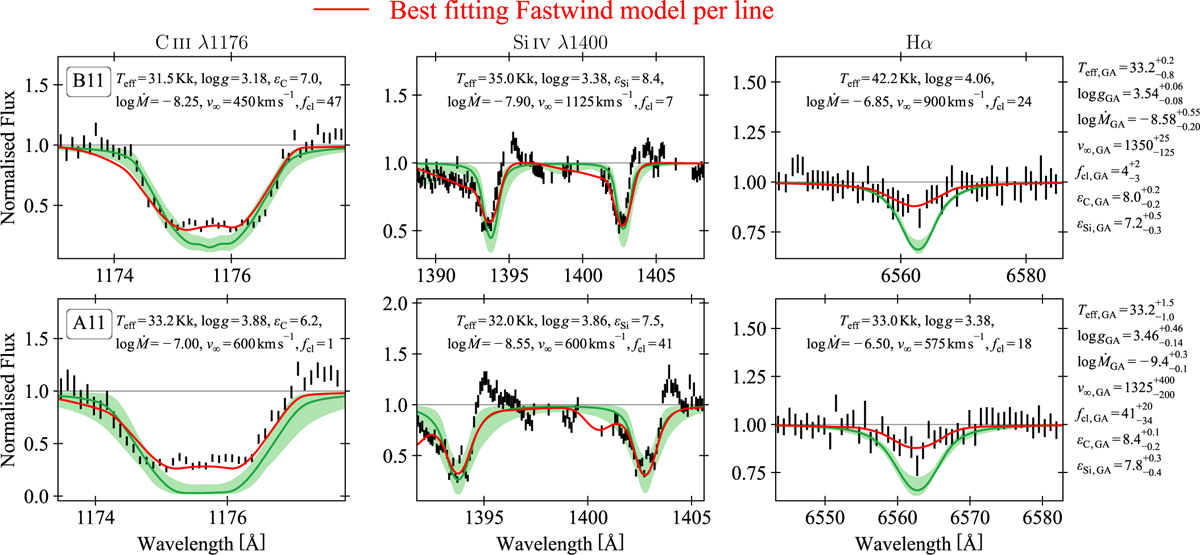
Best-fitting FASTWIND models per line determined by KIWI-GA (red) compared to the overall best-fitting FASTWIND model and 1σ uncertainties (green) in the optically thin formalism. The top and bottom rows are B11 and A11, respectively. On each axis, the main parameters of the best-fitting model of the line shown on the axis are given. For comparison, we give the parameters of the overall best-fitting model determined by KIWI-GA on the side of the figure.
Current usage metrics show cumulative count of Article Views (full-text article views including HTML views, PDF and ePub downloads, according to the available data) and Abstracts Views on Vision4Press platform.
Data correspond to usage on the plateform after 2015. The current usage metrics is available 48-96 hours after online publication and is updated daily on week days.
Initial download of the metrics may take a while.