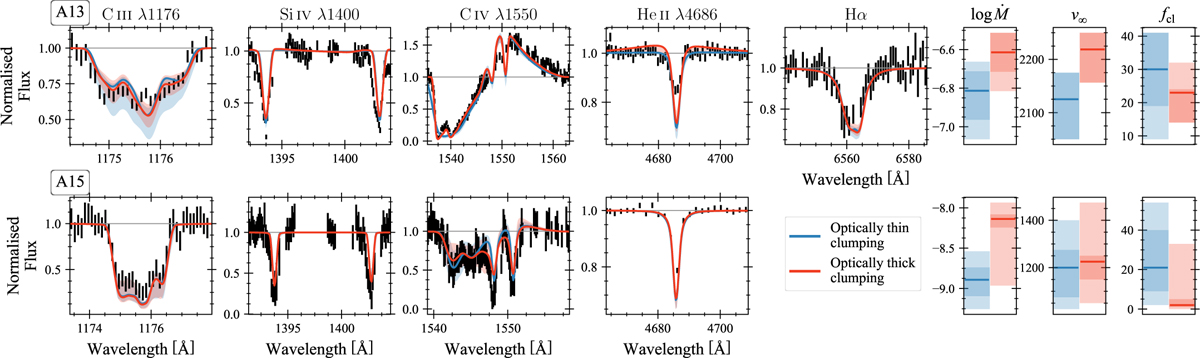
Fig. 11
Download original image
Comparing the optically thin formalism used in this work (blue) to the optically thick formalism (red) for A13 in IC 1613 (for which vwindturb is also a free parameter; top) and A15 in WLM (bottom). Also shown in the three rightmost plots are the best-fit (solid line), 1σ (dark shaded region), and 2σ (light shaded region) uncertainties obtained for Ṁ, v∞, and fcl for both runs.
Current usage metrics show cumulative count of Article Views (full-text article views including HTML views, PDF and ePub downloads, according to the available data) and Abstracts Views on Vision4Press platform.
Data correspond to usage on the plateform after 2015. The current usage metrics is available 48-96 hours after online publication and is updated daily on week days.
Initial download of the metrics may take a while.