Open Access
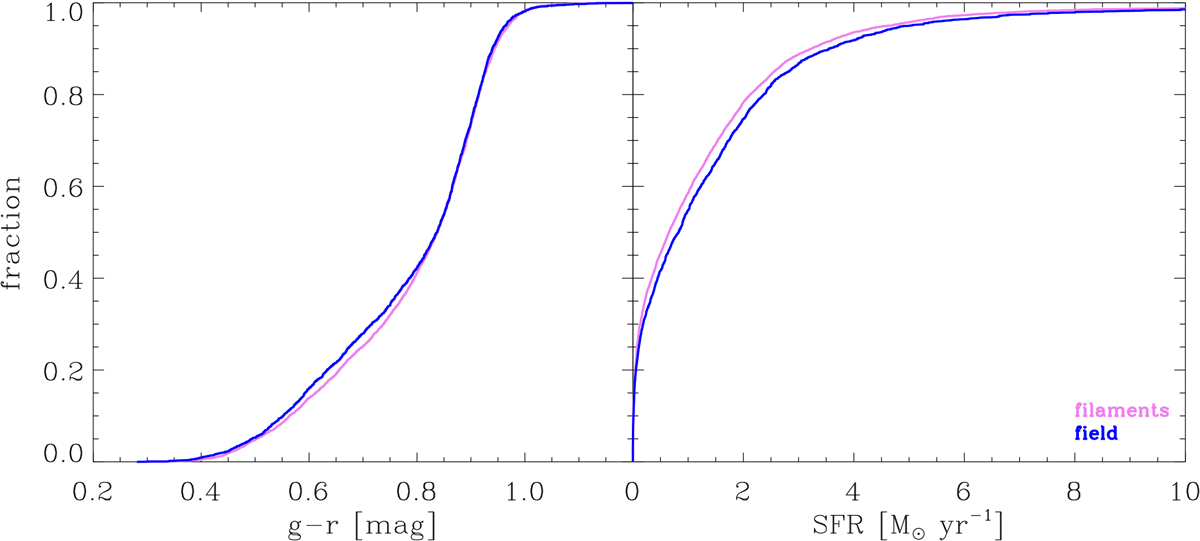
Fig. 7.
Download original image
Cumulative distribution functions of the g − r stellar colours (left panel) and SFR (right panel) of galaxies in the field (blue lines) and filaments (violet lines) for stellar mass-matched and overdensity-matched samples.
Current usage metrics show cumulative count of Article Views (full-text article views including HTML views, PDF and ePub downloads, according to the available data) and Abstracts Views on Vision4Press platform.
Data correspond to usage on the plateform after 2015. The current usage metrics is available 48-96 hours after online publication and is updated daily on week days.
Initial download of the metrics may take a while.