Fig. 4.
Download original image
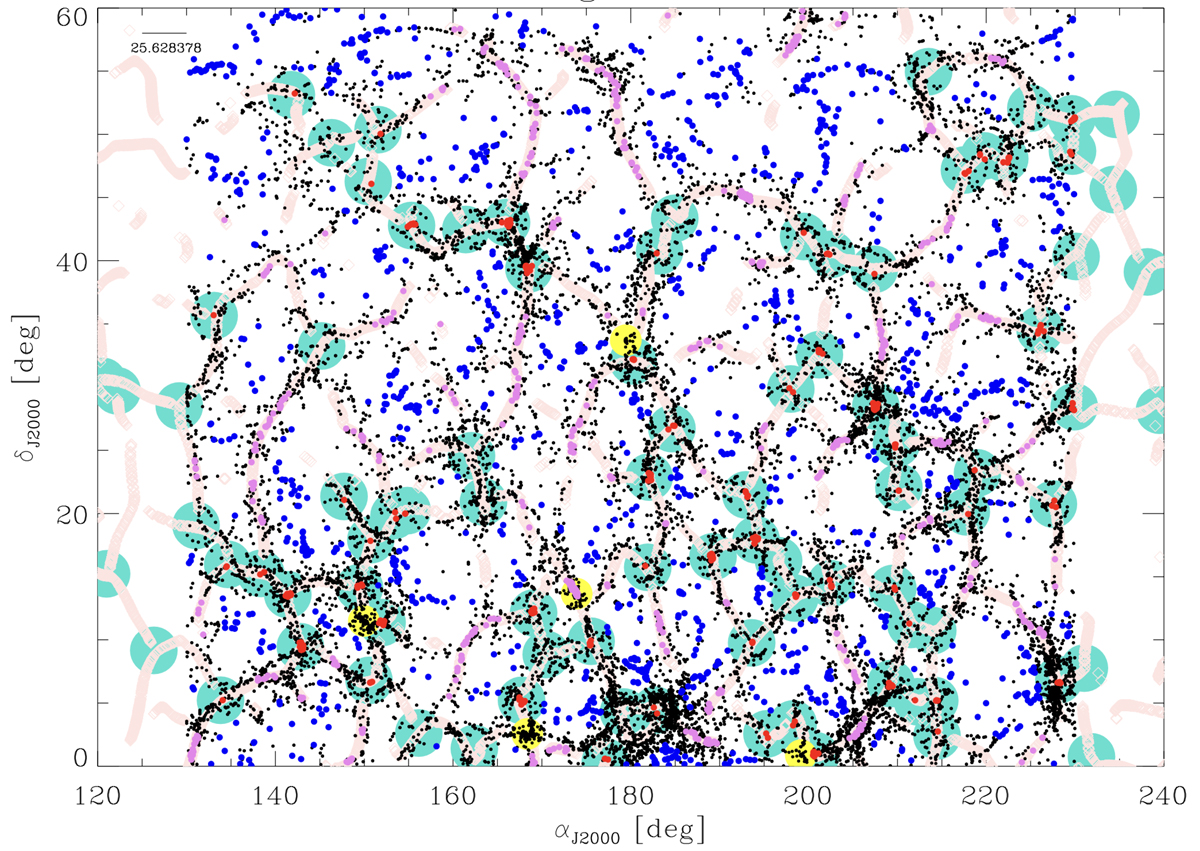
Plot of the entire field of view between redshift 0.075 < z < 0.08. Red galaxies are those selected to be close to intersections (Dint < 2 Mpc), violet galaxies are close to filaments only (Dint > 20 Mpc and Dfila < 1 Mpc), and blue galaxies are selected to be in the field (Dfila > 10 Mpc). The turquoise circles are intersections and the pink stripes are filaments from Chen et al. (2016). In yellow we show the positions of the eROSITA clusters that we used in this region. The symbol sizes of the filaments, intersections, and clusters are for display purposes only and have no connection with the physical sizes of these objects. The size in megaparsecs of the separation between two ticks (5 degrees) is indicated in the upper left corner of the image.
Current usage metrics show cumulative count of Article Views (full-text article views including HTML views, PDF and ePub downloads, according to the available data) and Abstracts Views on Vision4Press platform.
Data correspond to usage on the plateform after 2015. The current usage metrics is available 48-96 hours after online publication and is updated daily on week days.
Initial download of the metrics may take a while.