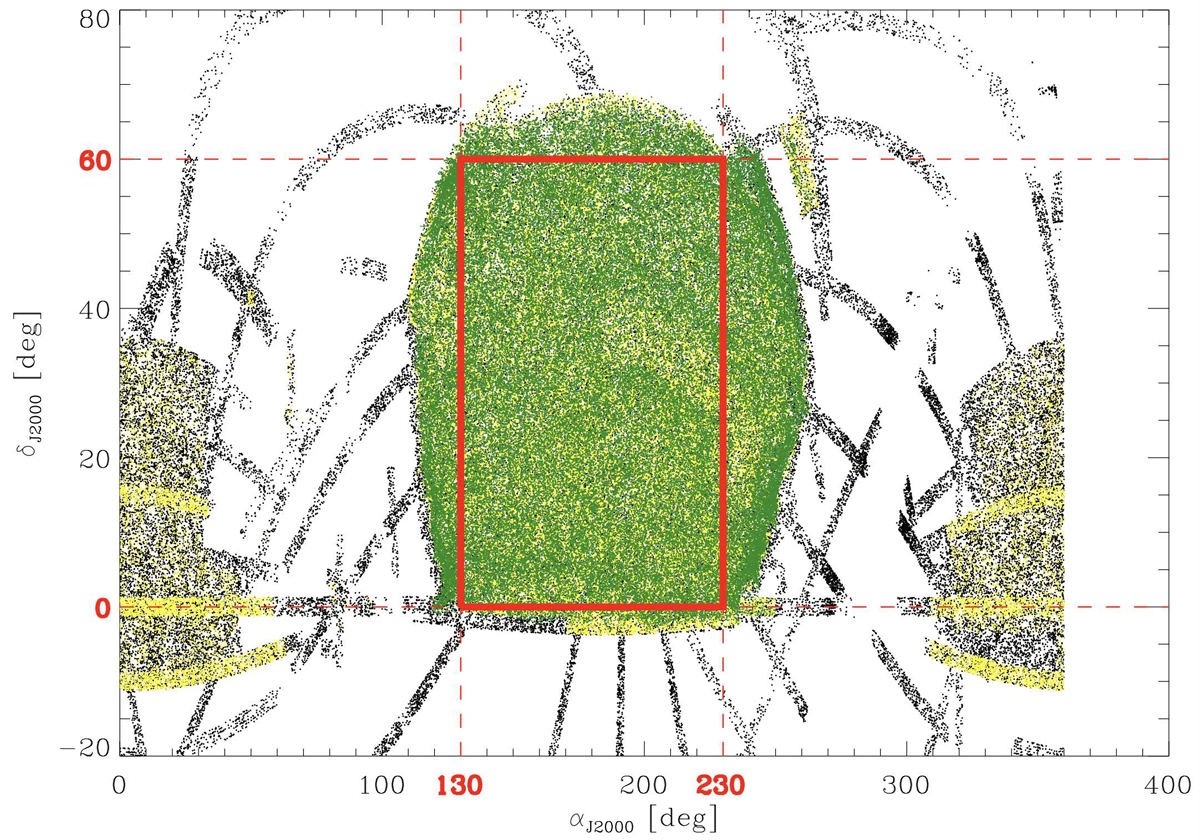
Fig. 1.
Download original image
SDSS footprint represented with black dots. In yellow, we show the galaxies with spectroscopic redshift. In green, we overplotted the region analysed by Chen et al. (2016). Finally, the area delimited by the red thick solid lines is the one used in this work and the corresponding αJ2000 and δJ2000 values are highlighted in red in the axes. We only rendered a random subsample of points for each colour. This was done for display purposes only.
Current usage metrics show cumulative count of Article Views (full-text article views including HTML views, PDF and ePub downloads, according to the available data) and Abstracts Views on Vision4Press platform.
Data correspond to usage on the plateform after 2015. The current usage metrics is available 48-96 hours after online publication and is updated daily on week days.
Initial download of the metrics may take a while.