Fig. 9
Download original image
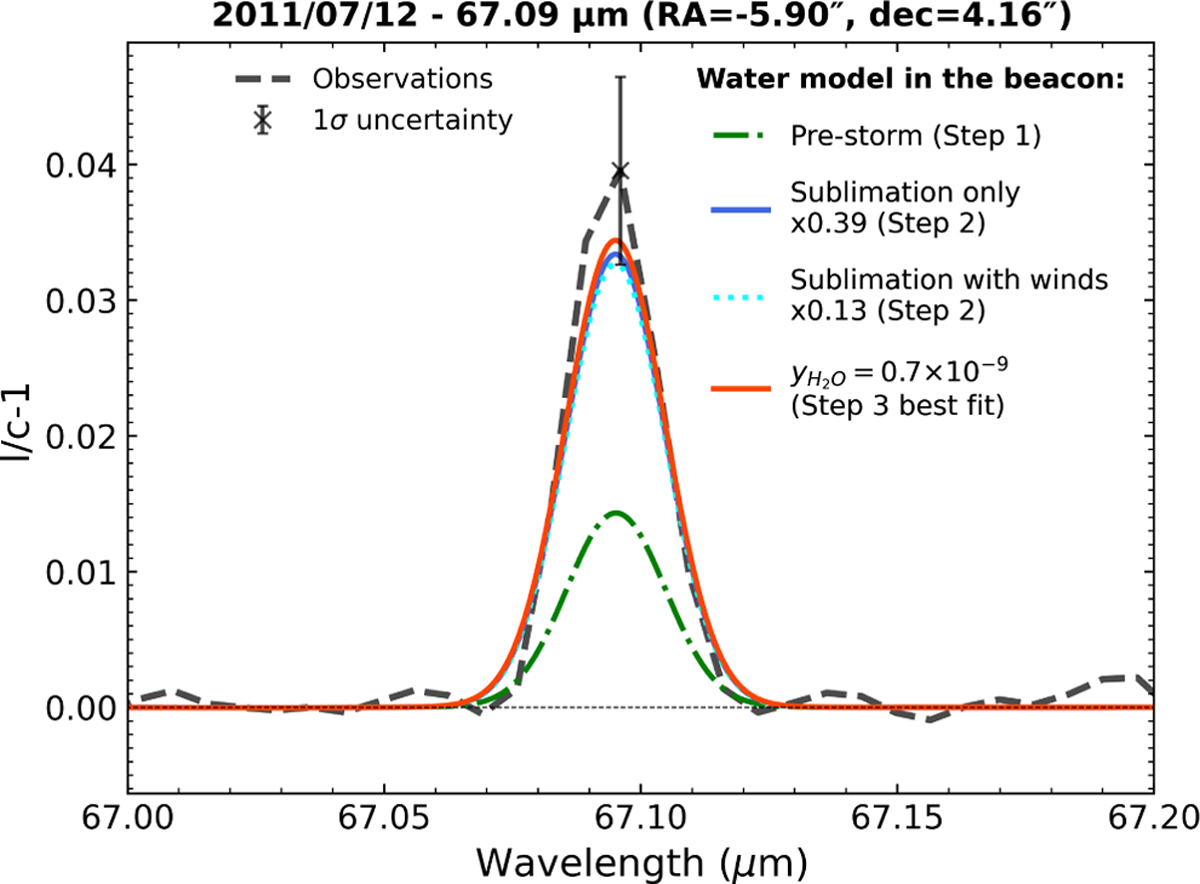
Example of observation and models of the water line at 67.09 μm at the centre of the beacon in July 2011, at the relative pointing coordinates RA=−5.90″, Dec=4.16″ (corresponding to the x-marker position in Fig. 8). The spectrum is expressed in terms of continuum-substracted line-to-continuum (1/c-1). The observed spectrum is in dashed grey lines. It is obtained after the calibration and baseline removal steps presented in Section 2.2. The dashed-dotted green line corresponds to a model in which only the temperature increase in the beacon is accounted for (Step 1 – see Section 4.1). The solid blue line and dotted cyan line represent the rescaled photochemical models (Step 2 – see Section 4.2) in which we consider only the haze sublimation (rescaled by a factor of 0.39), then we add the downward winds to the sublimation (rescaled by a factor of 0.13), respectively. The red line depicts a model in which the water mole fraction is fitted in the beacon as a single free parameter (Step 3 – see Section 4.3). The black point with error bars corresponds to the 1σ line amplitude uncertainty of about 15–20%, mostly caused by the baseline removal. This value is different from the line area uncertainty (see 2Section 2.2).
Current usage metrics show cumulative count of Article Views (full-text article views including HTML views, PDF and ePub downloads, according to the available data) and Abstracts Views on Vision4Press platform.
Data correspond to usage on the plateform after 2015. The current usage metrics is available 48-96 hours after online publication and is updated daily on week days.
Initial download of the metrics may take a while.