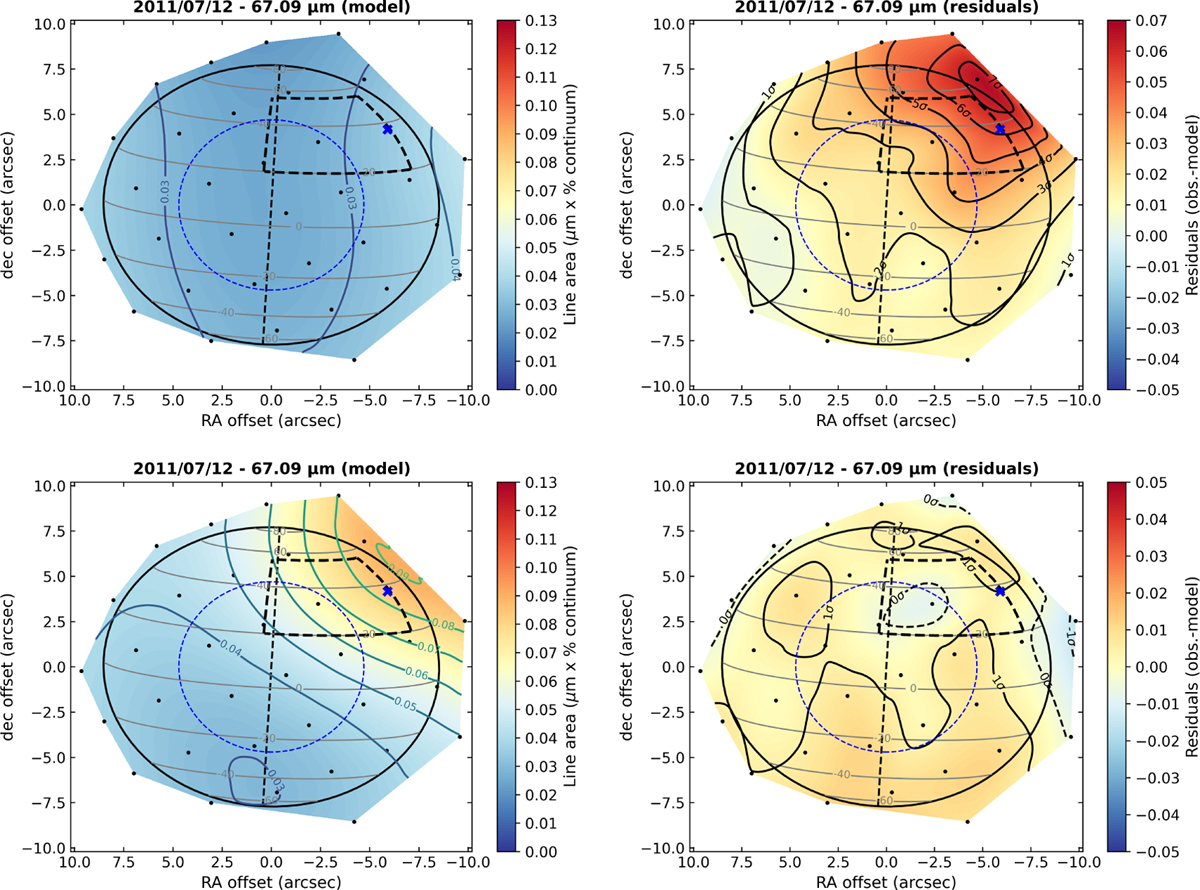
Fig. 8
Download original image
Modelled line area maps (left) and residual maps (right) for the first window (July 2011) and corresponding to the following models: (first row) Step 1, in which we keep the Gaussian-latitude-dependent profiles of Cavalié et al. (2019) with no water vapour in the beacon new layers delimited by the pre-storm condensation level at 2 mbar and the new condensation level; (second row) Step 3, in which we set the water vapour abundance as a constant free parameter in the beacon to fit the observations. The best fit of July 2011 is presented here. The ‘x’ markers in the maps at RA=−5.9″, Dec=4.2″ (i.e. in the beacon) correspond to the line of sight for which the observed and modelled spectra are shown in Fig. 9. The contours in the residuals are given in units of σ. The solid contours refer to positive residuals and the dashed contours indicate negative residuals. The results for the six other dates are presented in Fig. C.1 for Step 1, and Fig. D.1 for Step 3.
Current usage metrics show cumulative count of Article Views (full-text article views including HTML views, PDF and ePub downloads, according to the available data) and Abstracts Views on Vision4Press platform.
Data correspond to usage on the plateform after 2015. The current usage metrics is available 48-96 hours after online publication and is updated daily on week days.
Initial download of the metrics may take a while.