Fig. 6
Download original image
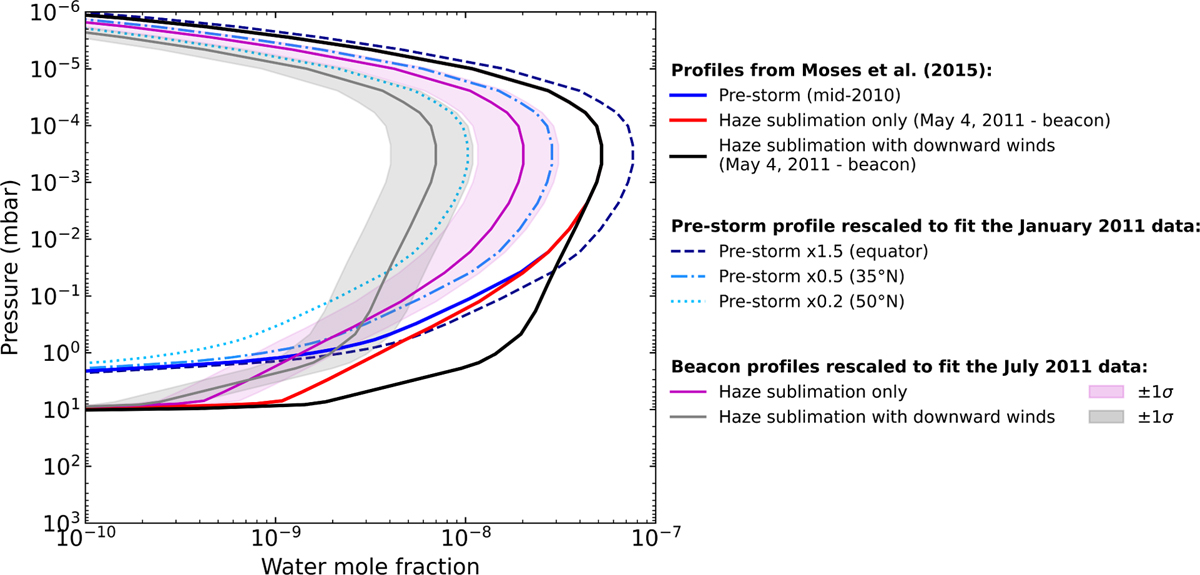
Water vertical profiles as a function of pressure derived from Moses et al. (2015) and from Moses, priv. comm. Their original photochemical profiles are depicted by the thick solid blue, red, and black lines, respectively, in the pre-storm conditions, in the haze sublimation model, and the vertical transport with haze sublimation model. They are derived from a disc-averaged value for the water influx at the top of the atmosphere. As these profiles originate from a disc-averaged observation of water in the stratosphere of Saturn, we first had to rescale the pre-storm profile as a function of latitude following the water distribution found by Cavalié et al. (2019) with an additional fitting factor to reproduce the January 2011 data. The resulting water profiles are plotted in blue at different latitudes. The purple and grey areas represent the best fit results for July 2011 with the two rescaled water models in the beacon.
Current usage metrics show cumulative count of Article Views (full-text article views including HTML views, PDF and ePub downloads, according to the available data) and Abstracts Views on Vision4Press platform.
Data correspond to usage on the plateform after 2015. The current usage metrics is available 48-96 hours after online publication and is updated daily on week days.
Initial download of the metrics may take a while.