Fig. 5
Download original image
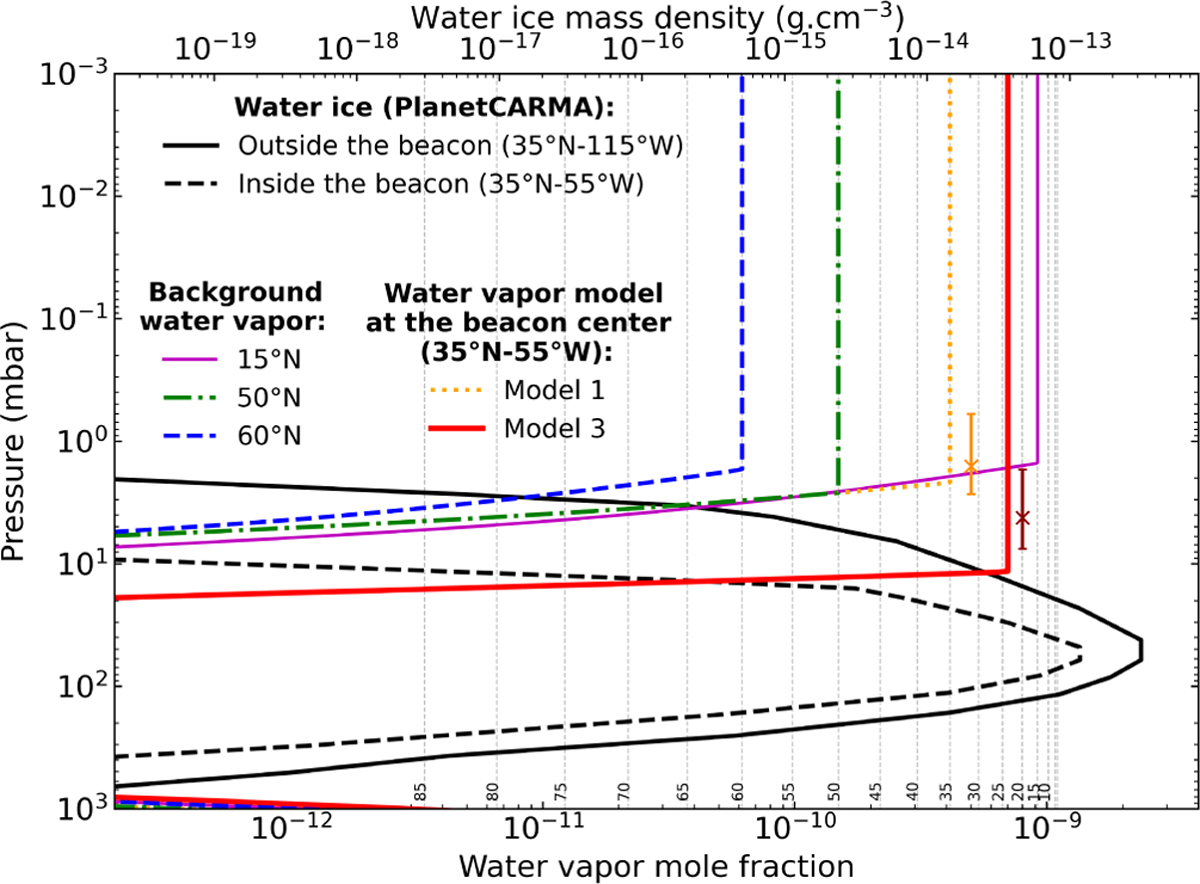
Profiles of the water vapour mole fraction (bottom x scale) and the water ice mass density (top x scale) as a function of pressure. The water vapour profiles are extracted from the water 3D field of July 12 2011. The solid purple line, the dashed-dotted green line and the dashed blue line depict the background field derived from Cavalié et al. (2019) at, respectively, 15,50, and 60°N. The thin vertical dashed lines represent the values of the water vapour mole fraction at ~1–2 mbar found in Cavalié et al. (2019) in quiescent conditions, as a function of latitude. The latitudes are labelled vertically at the bottom of the graph. Model 1 (dotted orange line) indicates the water profile of Step 1 (see Section 4.1) in which we keep the pre-storm water field of Cavalié et al. (2019) to test the enhancement of the water line amplitude due to temperature increase only. The red line shows the best fit of Model 3 (i.e. Step 3, Section 4.3) for July 2011, in which we vary the water mole fraction in the beacon. The orange and dark red bars represent the vertical sensitivity range from the water contribution functions, corresponding to the Step 1 and Step 3 models, respectively (see also Fig. 7). The crosses correspond to the altitude of maximum contribution to the line. The water ice profiles were computed with the PlanetCARMA cloud model of Barth (2020) adapted to the Saturn stratosphere with the July 122011 thermal profile outside the beacon at 35°N–115°W for the solid black line and inside the beacon at 35°N–55°W for the dashed black line.
Current usage metrics show cumulative count of Article Views (full-text article views including HTML views, PDF and ePub downloads, according to the available data) and Abstracts Views on Vision4Press platform.
Data correspond to usage on the plateform after 2015. The current usage metrics is available 48-96 hours after online publication and is updated daily on week days.
Initial download of the metrics may take a while.