Fig. 4
Download original image
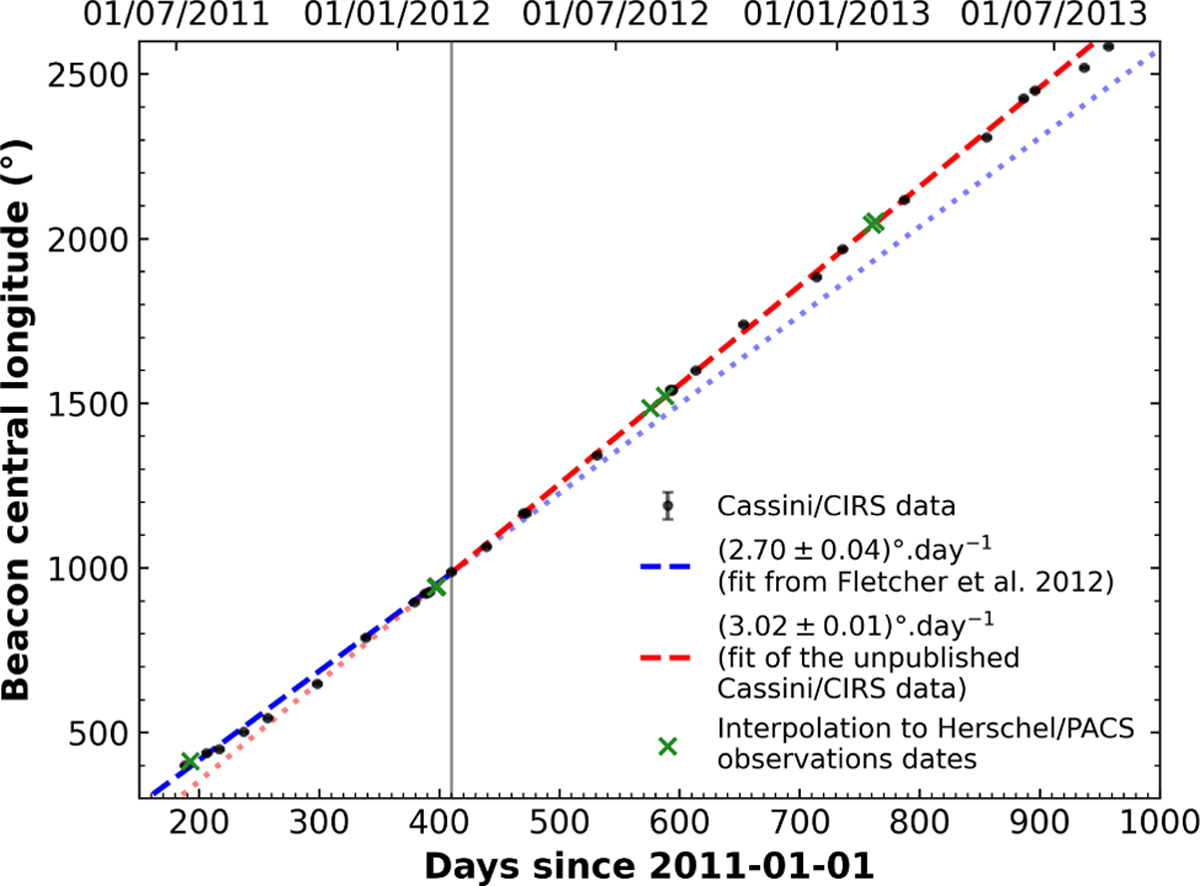
Central longitude of the beacon through time. The black dots are derived from the Cassini/CIRS thermal fields averaged on the 25–45°N latitudinal band, i.e. for an average latitude of 35°N, at the millibar level in the stratosphere. Data points are derived from the longitudinal centre position of the beacon, calculated as the middle of the longitude-temperature curve, which is rather symmetric with respect to the middle longitude. The dashed blue line represents the trend from Fletcher et al. (2012) between July 2011 and March 2012. The dashed red line shows the trend after March 2012 derived in this paper. The dotted lines correspond to the extrapolation of the two trends. The vertical grey line delimits the two temporal periods. The interpolation at our Herschel/PACS observations dates are represented by the green x-shaped points.
Current usage metrics show cumulative count of Article Views (full-text article views including HTML views, PDF and ePub downloads, according to the available data) and Abstracts Views on Vision4Press platform.
Data correspond to usage on the plateform after 2015. The current usage metrics is available 48-96 hours after online publication and is updated daily on week days.
Initial download of the metrics may take a while.