Fig. 3
Download original image
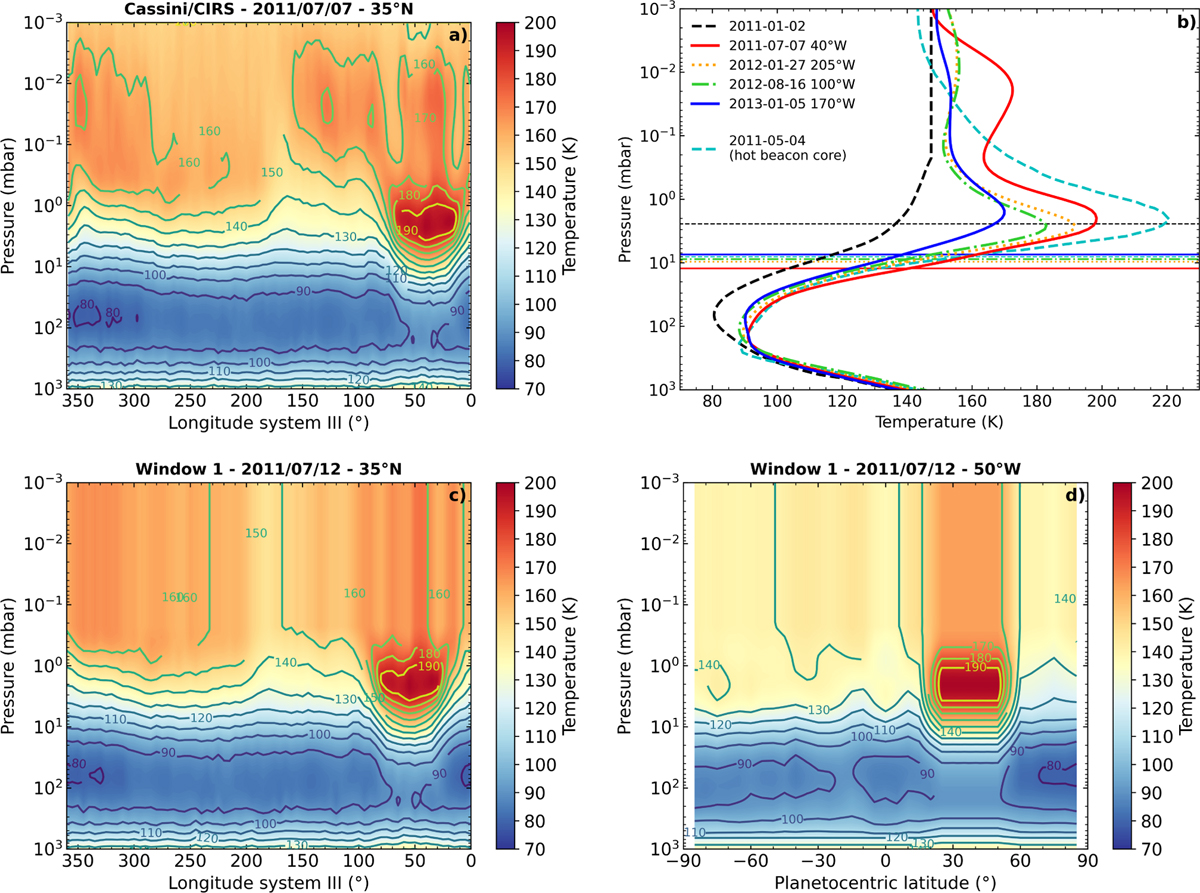
(a and b) Temperature fields at an averaged latitude of 35°N retrieved from Cassini/CIRS observations by Fletcher et al. (2012). (a) Pressurelongitude cut for July 7, 2011. (b) Vertical profiles extracted from the July 7, 2011, January 27, 2012, August 16, 2012, and January 5, 2013 thermal fields (see Fig. A.1). The coloured lines are taken at the central longitude of the beacon. The central longitude is defined following the beacon drift presented in Section 3.1.3. The dashed black line represents the quiescent conditions (taken here on January 2, 2011) at the early stages of the storm. The May 4, 2011 hot beacon core temperature profile is depicted by the dashed sky-blue line and was used in the photochemical model of Moses et al. (2015). The horizontal lines represent the water condensation level calculated using Fray & Schmitt (2009) for each temperature profile (same colour and line code for a given date). (c and d) Final thermal fields used in our radiative transfer calculations for the first window (July 12, 2011), constructed from the above Cassini/CIRS data and the background seasonal data from Fletcher et al. (2018). An isothermal extrapolation from 0.2 mbar to the top of the atmosphere was performed. (c) Similar to (a) at 35°N, after the beacon drift was accounted for. (d) Pressure-latitude constructed field at 50°W.
Current usage metrics show cumulative count of Article Views (full-text article views including HTML views, PDF and ePub downloads, according to the available data) and Abstracts Views on Vision4Press platform.
Data correspond to usage on the plateform after 2015. The current usage metrics is available 48-96 hours after online publication and is updated daily on week days.
Initial download of the metrics may take a while.