Fig. 2
Download original image
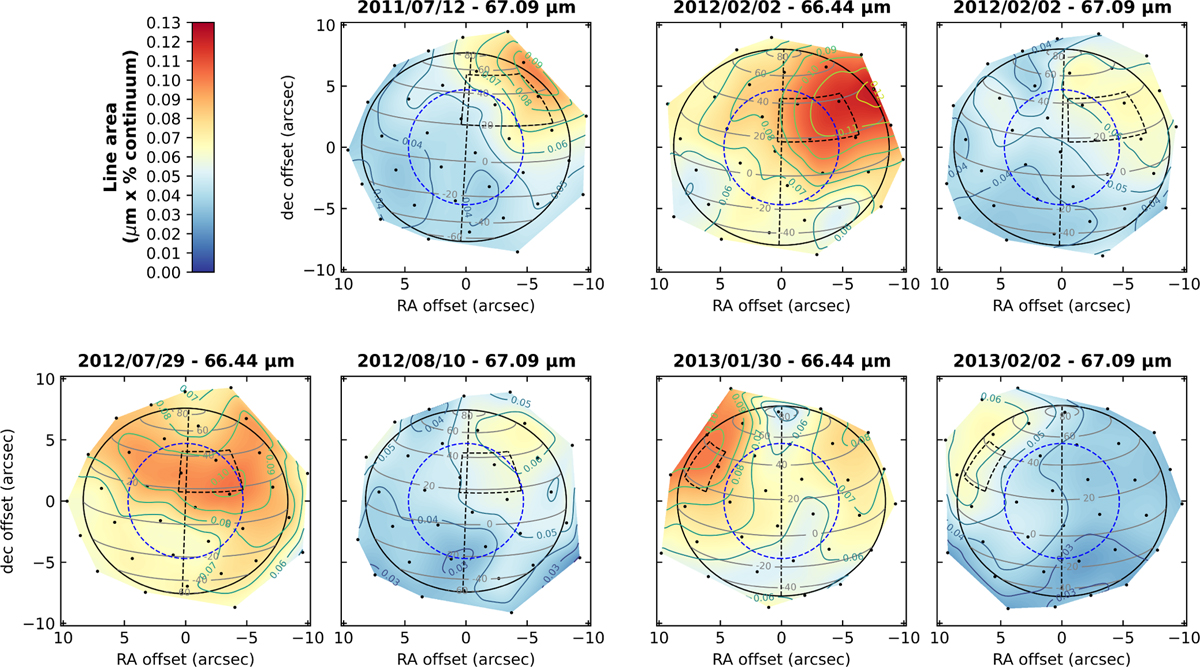
Water line area maps expressed in units of μm×% of continuum. The four observation time windows are July 2011 at 67.09 μm, February 2012 at 66.44 and 67.09 μm, July–August 2012 at 66.44 and 67.09 μm, and January–February 2013 at 66.44 and 67.09 μm. Saturn’s 1-bar level is represented by the black ellipse, with the north pole facing upwards. A selection of iso-latitudes are plotted with grey lines. The rotation axis corresponds to the thin dashed black line. The beam spatial extent is illustrated by the circle in a dashed blue line. The black dots correspond to the central position of the spatial pixels. The position and extension of the beacon (see Table 3) at mid-observation time is represented with the thick dashed black lines. A cubic interpolation was applied to the data.
Current usage metrics show cumulative count of Article Views (full-text article views including HTML views, PDF and ePub downloads, according to the available data) and Abstracts Views on Vision4Press platform.
Data correspond to usage on the plateform after 2015. The current usage metrics is available 48-96 hours after online publication and is updated daily on week days.
Initial download of the metrics may take a while.