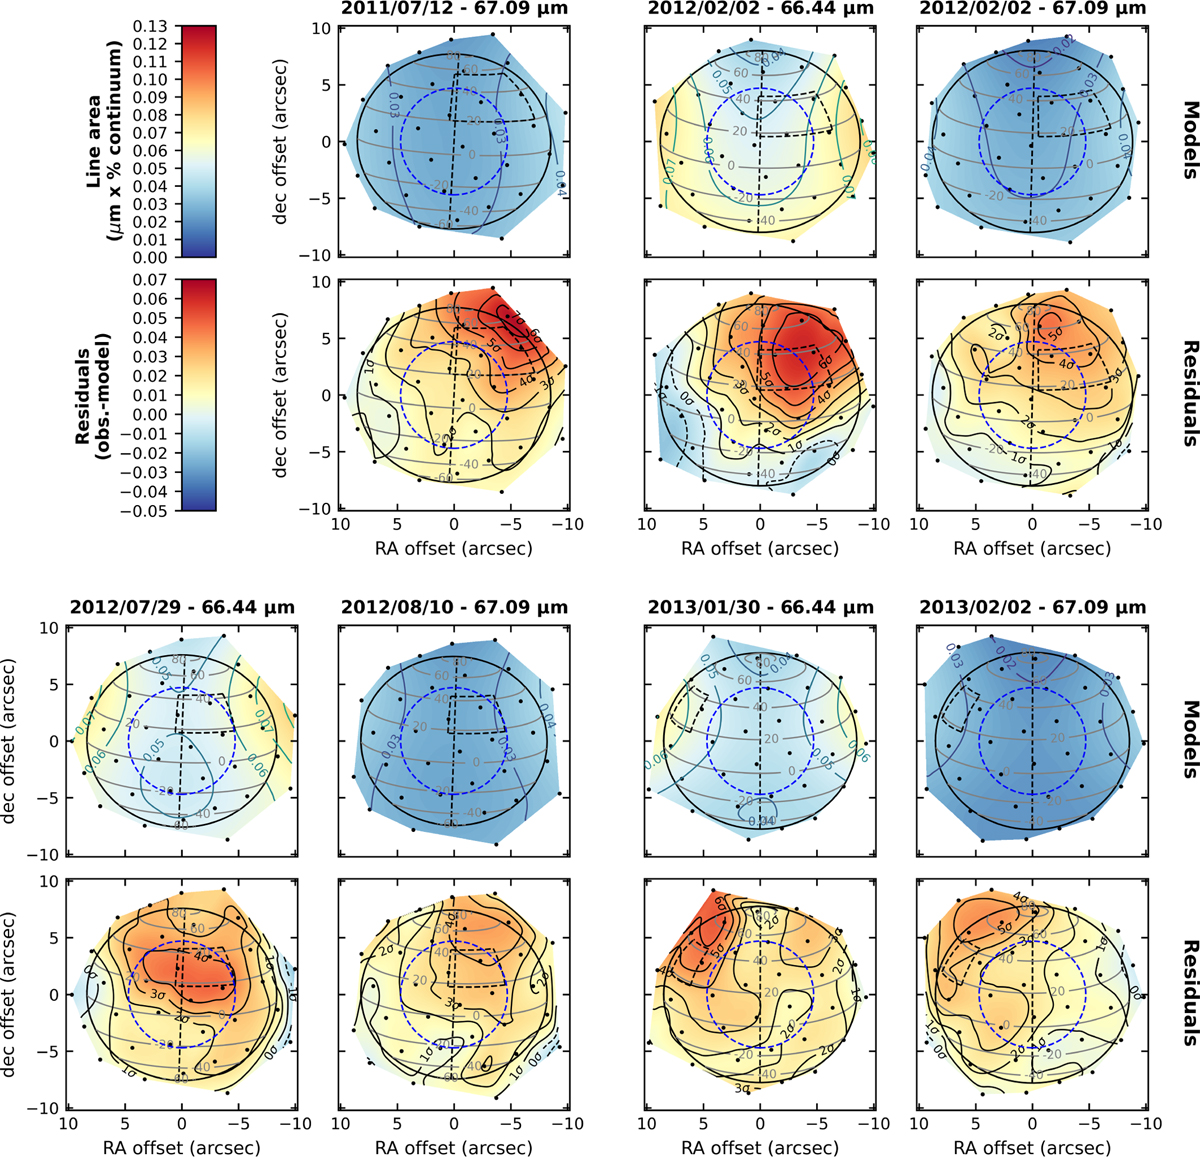
Fig. C.1
Download original image
Modelled H2O water line area maps and residuals obtained within Step 1 (nominal water field of Cavalié et al. 2019), for the seven observation windows. The modelled line area maps are displayed in rows 1 and 3. The units are expressed as μm×% of continuum to directly compare to the observation maps of Fig. 2. The corresponding residual maps are presented in rows 2 and 4 and correspond to the difference between the observed maps of Fig. 2 and the above modelled maps. The contours are given in units of σ. The solid contours refer to positive residuals and the dashed contours indicate negative residuals. The colour scales of the modelled and residual maps are shown on the top left corner. The overall description of the maps is the same as in Fig. 2.
Current usage metrics show cumulative count of Article Views (full-text article views including HTML views, PDF and ePub downloads, according to the available data) and Abstracts Views on Vision4Press platform.
Data correspond to usage on the plateform after 2015. The current usage metrics is available 48-96 hours after online publication and is updated daily on week days.
Initial download of the metrics may take a while.