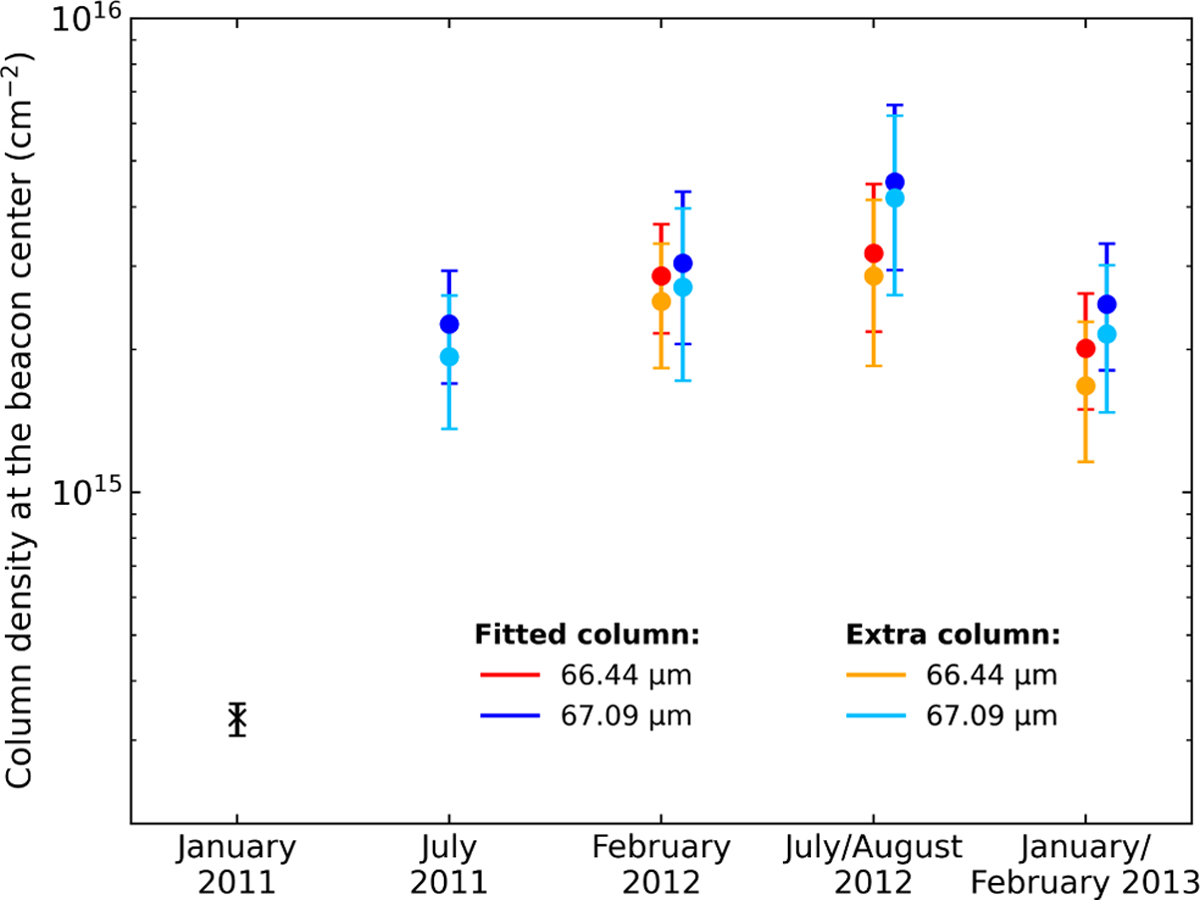
Fig. 12
Download original image
Column density at the beacon centre (35°N and central longitude) as a function of time. The column densities are integrated from ~100 mbar towards the top of the atmosphere. The cross point in January 2011 is derived from the background water field of Cavalié et al. (2019) at 35° N. Darker coloured points relate to the fitting of the observations with a constant water mole fraction in the beacon. Light coloured points refer to the fitted water column density after subtracting the pre-storm column of January 2011, and therefore show the additional column density coming from a combination of vertical winds and sublimation. The red/orange points correspond to the water maps at 66.44 μm and the dark blue/light blue to those at 67.09 μm.
Current usage metrics show cumulative count of Article Views (full-text article views including HTML views, PDF and ePub downloads, according to the available data) and Abstracts Views on Vision4Press platform.
Data correspond to usage on the plateform after 2015. The current usage metrics is available 48-96 hours after online publication and is updated daily on week days.
Initial download of the metrics may take a while.