Fig. 11
Download original image
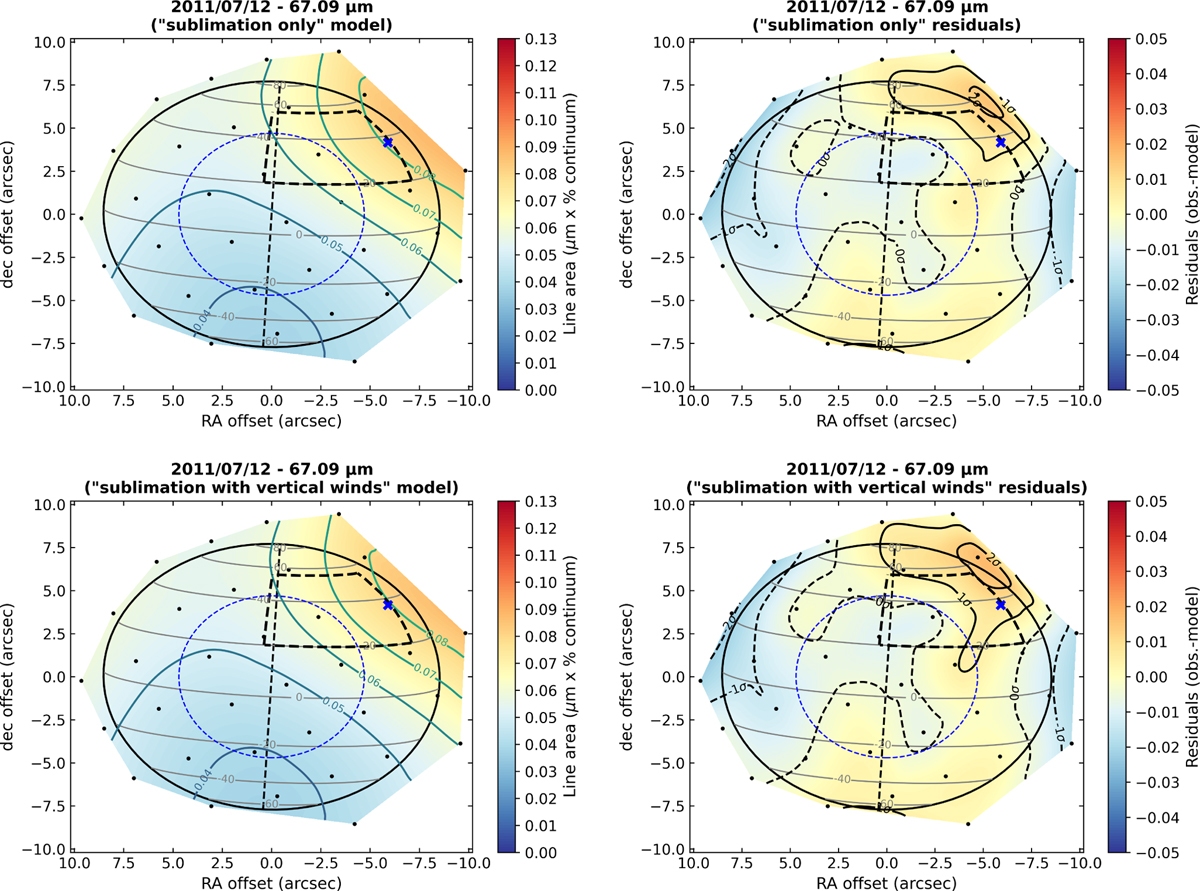
Modelled line area maps (left) and residual maps (right) for the two water models of Moses et al. (2015): a first water profile considering only the sublimation of the water haze in the beacon (top) and a second model in which the vertical downwelling winds are added on top of the haze sublimation (bottom), both in the hot beacon core model of May 4 2011. The two profiles were used only on our first observation window (July 12, 2011) which is the closest water observation to the hot beacon core model. The two profiles were copied uniformly in the beacon region and multiplied by a factor to fit the data. The background water field is derived from the fit of the January 2011 data with the pre-storm profile. The contours are given in units of σ. The solid contours refer to positive residuals and the dashed contours indicate negative residuals. The ‘x’ markers at RA=−5.9″, Dec=4.2″ (i.e. in the beacon) correspond to the line of sight for which the observed and modelled spectra are shown in Fig. 9. The overall description of the maps is the same as in Fig. 2.
Current usage metrics show cumulative count of Article Views (full-text article views including HTML views, PDF and ePub downloads, according to the available data) and Abstracts Views on Vision4Press platform.
Data correspond to usage on the plateform after 2015. The current usage metrics is available 48-96 hours after online publication and is updated daily on week days.
Initial download of the metrics may take a while.