Fig. 10
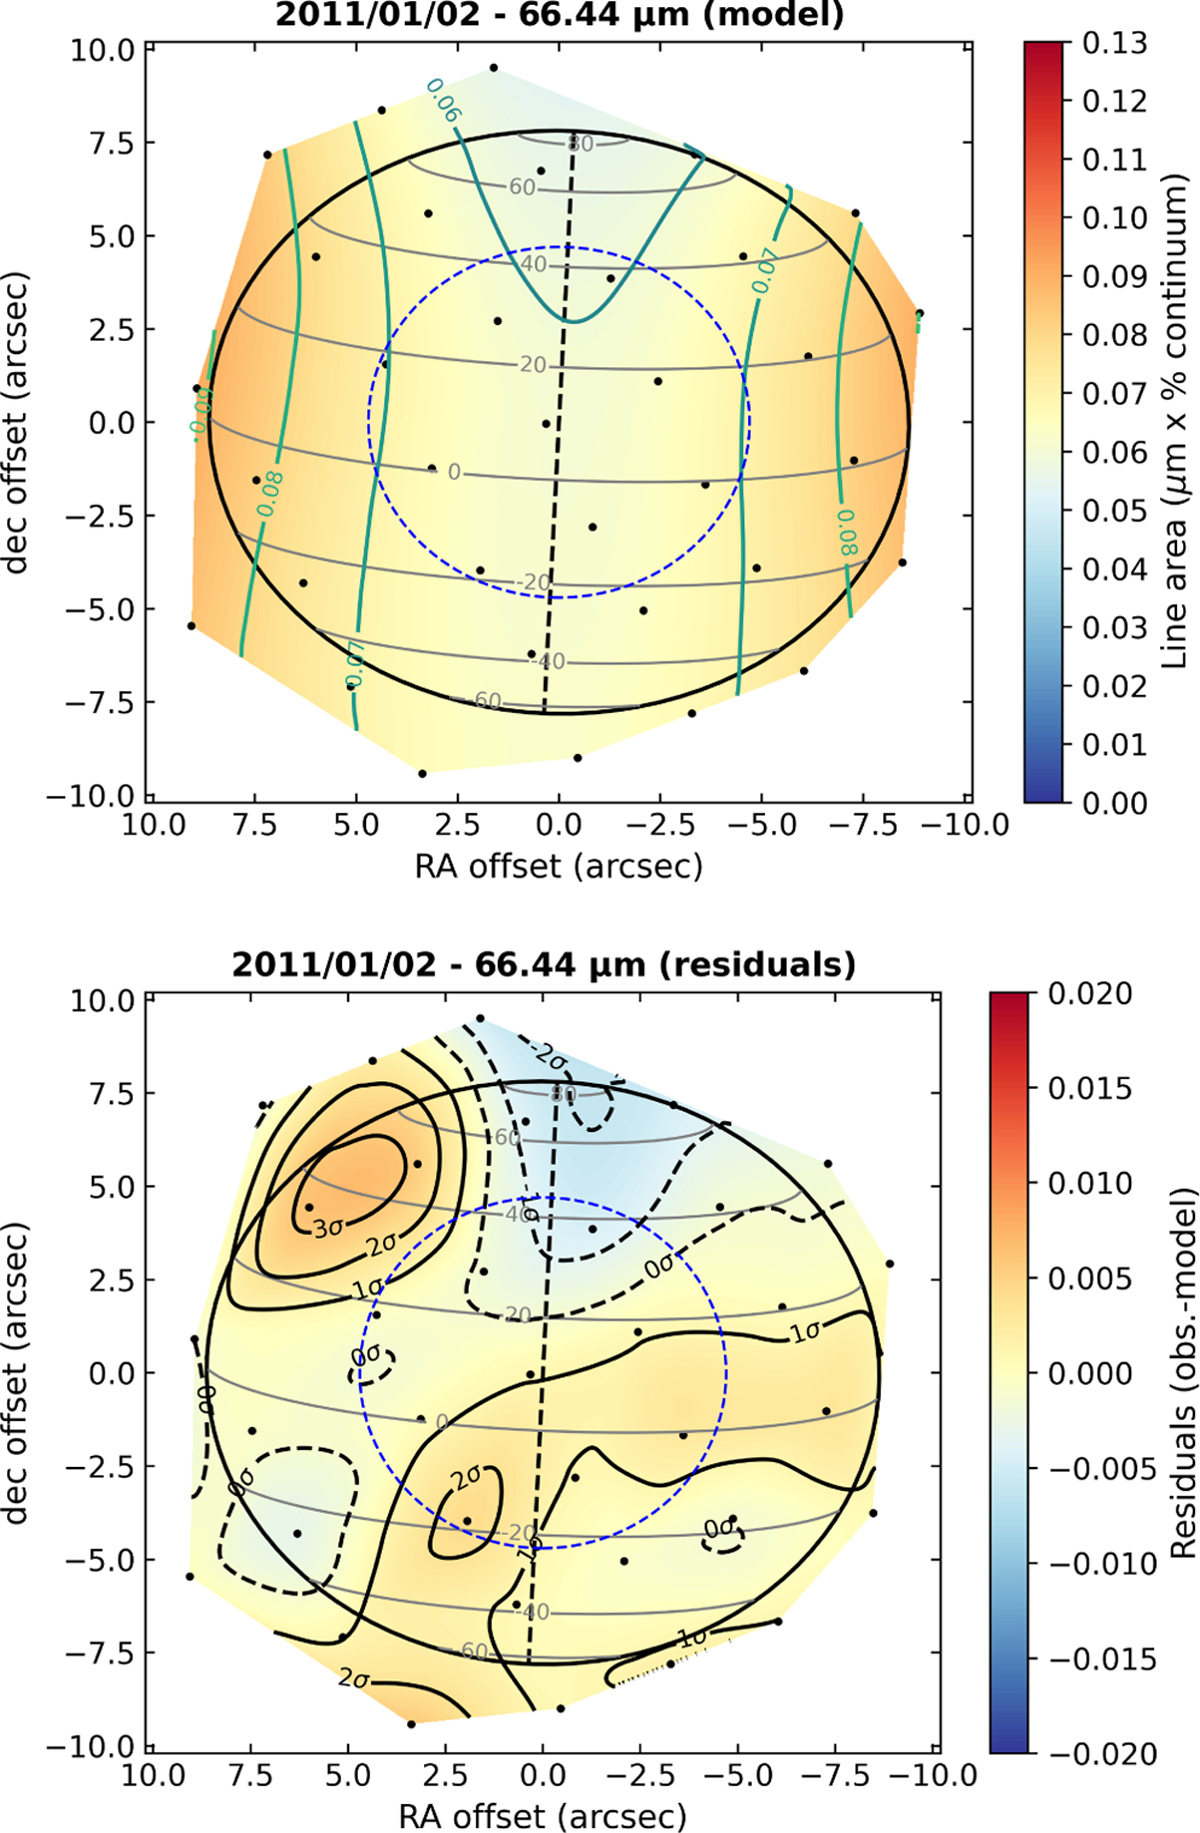
Download original image
Modelled line area map (top) and residual map (bottom) for the best fit of January 2, 2011 data (Cavalié et al. 2019) with the prestorm model of Moses et al. (2015). The residual map corresponds to the difference between the observed map of Cavalié et al. (2019) (Fig. 2) and the modelled map. The contours are given in units of σ. The solid contours refer to positive residuals and the dashed contours indicate negative residuals. The overall description of the maps is the same as in Fig. 2.
Current usage metrics show cumulative count of Article Views (full-text article views including HTML views, PDF and ePub downloads, according to the available data) and Abstracts Views on Vision4Press platform.
Data correspond to usage on the plateform after 2015. The current usage metrics is available 48-96 hours after online publication and is updated daily on week days.
Initial download of the metrics may take a while.