Fig. 1
Download original image
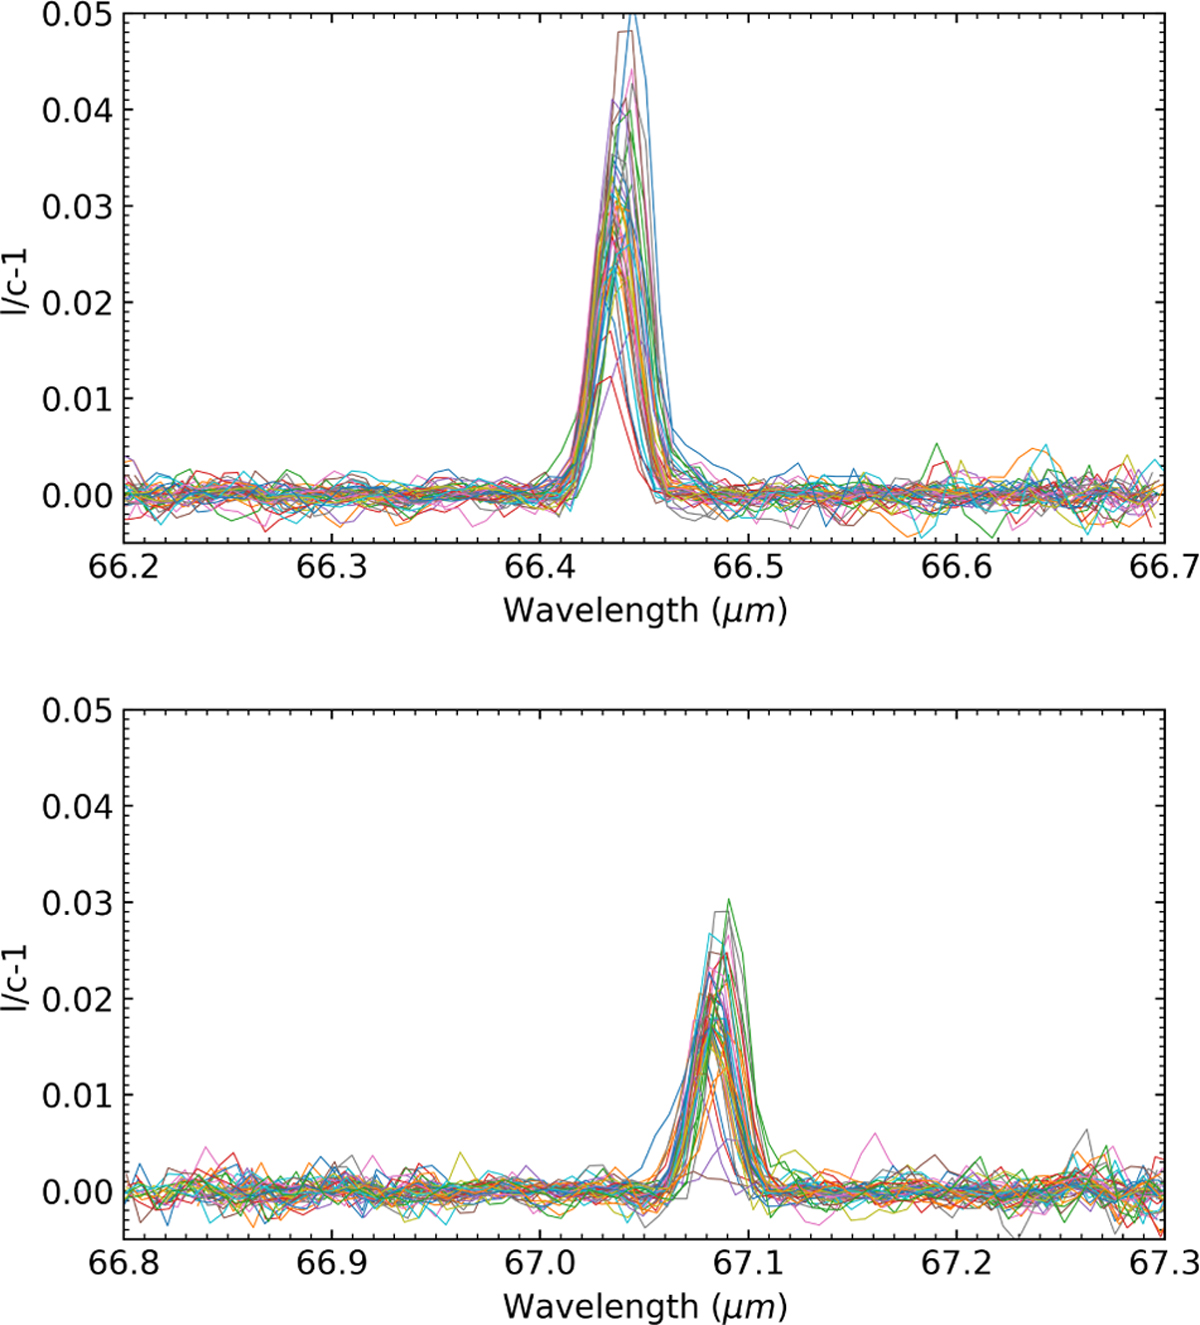
Observed spectra after baseline removal for the second observation window (February 2012) at 66.44 μm (top) and 67.09 μm (bottom). The spectra are presented as line-to-continuum ratio minus one. The scatter in the peak position of the line is mainly due to Doppler shift induced by Saturn’s rapid rotation. For both observations, all the plotted spectra correspond to the pointings selected within the planetary disc, as shown with the black dots on Fig. 2 second row (i.e. second observation window).
Current usage metrics show cumulative count of Article Views (full-text article views including HTML views, PDF and ePub downloads, according to the available data) and Abstracts Views on Vision4Press platform.
Data correspond to usage on the plateform after 2015. The current usage metrics is available 48-96 hours after online publication and is updated daily on week days.
Initial download of the metrics may take a while.