Fig. 8.
Download original image
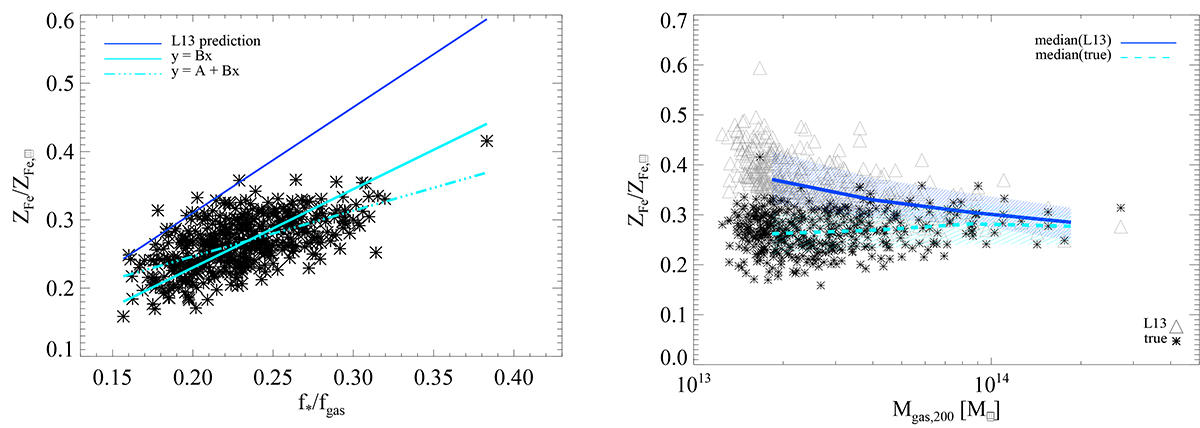
Comparison between the simulated ICM mass-weighted iron abundance ZFe/ZFe,⊙ and the L13 prediction based on the stellar-to-gas fraction f*/fICM as in Eq. (5) for the region within R200. Left: relation between ZFe/ZFe,⊙ and f*/fICM for the simulated clusters (black asterisks), compared to the L13 relation (blue solid line). Overplotted two best-fit relations (cyan solid and dot-dashed lines, as in the legend) to the simulation data. Right: iron abundance as a function of simulated gas masses. Two estimates of ZFe/ZFe,⊙ are compared: the mass-weighted value computed directly from the simulation (“true”; black asterisks) and the value predicted for each simulated cluster given its stellar-to-gas fraction (“L13”; grey triangles). We mark median values in five mass bins for both the true (dashed cyan line) and the L13 (solid blue line) estimate, as well as the respective scatter (shaded areas) between the 16th and the 84th percentile of the distributions.
Current usage metrics show cumulative count of Article Views (full-text article views including HTML views, PDF and ePub downloads, according to the available data) and Abstracts Views on Vision4Press platform.
Data correspond to usage on the plateform after 2015. The current usage metrics is available 48-96 hours after online publication and is updated daily on week days.
Initial download of the metrics may take a while.