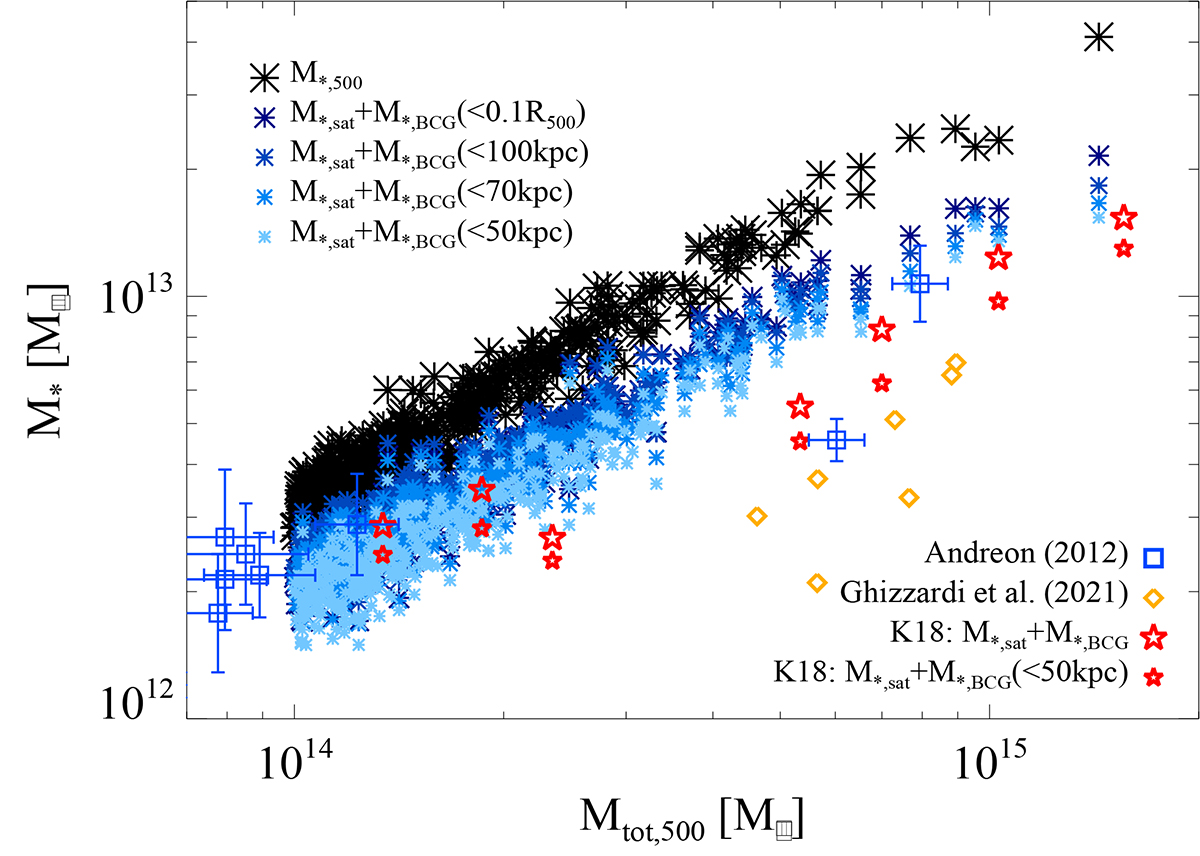
Fig. 7.
Download original image
Scaling relations between stellar mass and total halo mass Mtot,500 within R500c for the simulated clusters compared to the observational data. Simulated datapoints refer to stellar masses within R500 (M*,500; black asterisks), and to values obtained by summing up the satellite stellar mass, M*,sat, and the BCG stellar mass, M*,BCG, computed within 0.1 R500 (dark-blue asterisks), 100 kpc (blue asterisks), 70 kpc (light-blue asterisks), and 50 kpc (cyan asterisks), as in the upper-left legend. Observational data are from Ghizzardi et al. (2021) (yellow diamonds) and Andreon (2012b) (blue squares), as from their samples also the iron share estimates were derived, and from Kravtsov et al. (2018) (K18; red stars). For the latter, we report two estimates, given by the sum of the satellite stellar mass, Msat (see their Tables 1 and 4), and the BCG stellar mass within 50 kpc, MBCG(<50 kpc) (small symbols), and extrapolated to infinity from their best-fit Sérsic profile, MBCG (big symbols).
Current usage metrics show cumulative count of Article Views (full-text article views including HTML views, PDF and ePub downloads, according to the available data) and Abstracts Views on Vision4Press platform.
Data correspond to usage on the plateform after 2015. The current usage metrics is available 48-96 hours after online publication and is updated daily on week days.
Initial download of the metrics may take a while.