Fig. 2.
Download original image
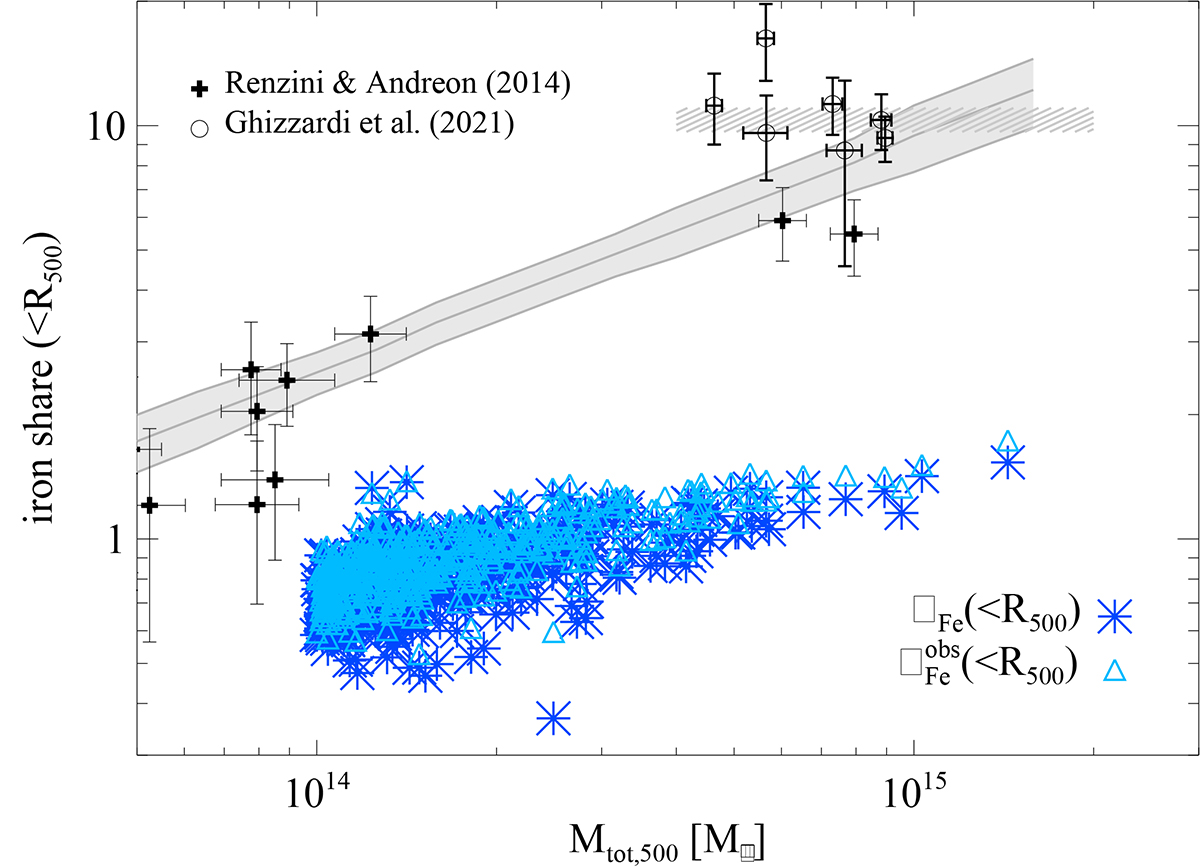
Comparison of the iron share from simulations and observational data by Renzini & Andreon (2014) (black crosses and solid line with the grey shaded area) and Ghizzardi et al. (2021) (black open circles and dashed shaded area). The two simulation estimates of the iron share are derived by either computing directly the iron mass within stars (as in Fig. 1; large blue asterisks; “sim”) or by converting the stellar mass into iron mass assuming solar abundance, similarly to observations (Eq. (3); small cyan triangles; “obs-like”).
Current usage metrics show cumulative count of Article Views (full-text article views including HTML views, PDF and ePub downloads, according to the available data) and Abstracts Views on Vision4Press platform.
Data correspond to usage on the plateform after 2015. The current usage metrics is available 48-96 hours after online publication and is updated daily on week days.
Initial download of the metrics may take a while.