Open Access
Fig. 2.
Download original image
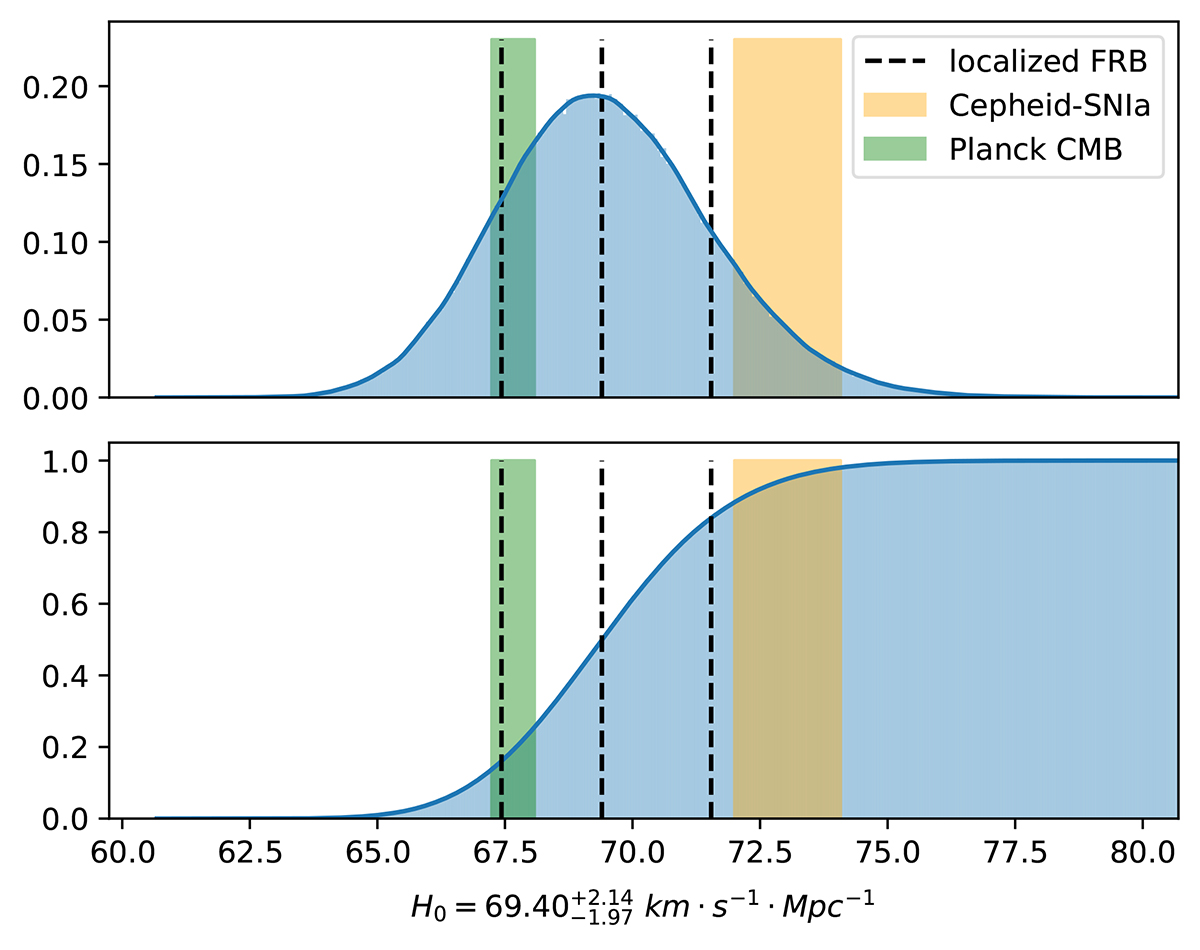
Probability density function and cumulative distribution function of H0 given by 108 localized FRBs. The vertical line shows our result ![]() km s−1 Mpc−1 with 1σ uncertainty. The orange and green regions show the 1σ confidence intervals given by SNe Ia and the CMB, respectively.
km s−1 Mpc−1 with 1σ uncertainty. The orange and green regions show the 1σ confidence intervals given by SNe Ia and the CMB, respectively.
Current usage metrics show cumulative count of Article Views (full-text article views including HTML views, PDF and ePub downloads, according to the available data) and Abstracts Views on Vision4Press platform.
Data correspond to usage on the plateform after 2015. The current usage metrics is available 48-96 hours after online publication and is updated daily on week days.
Initial download of the metrics may take a while.