Fig. 1.
Download original image
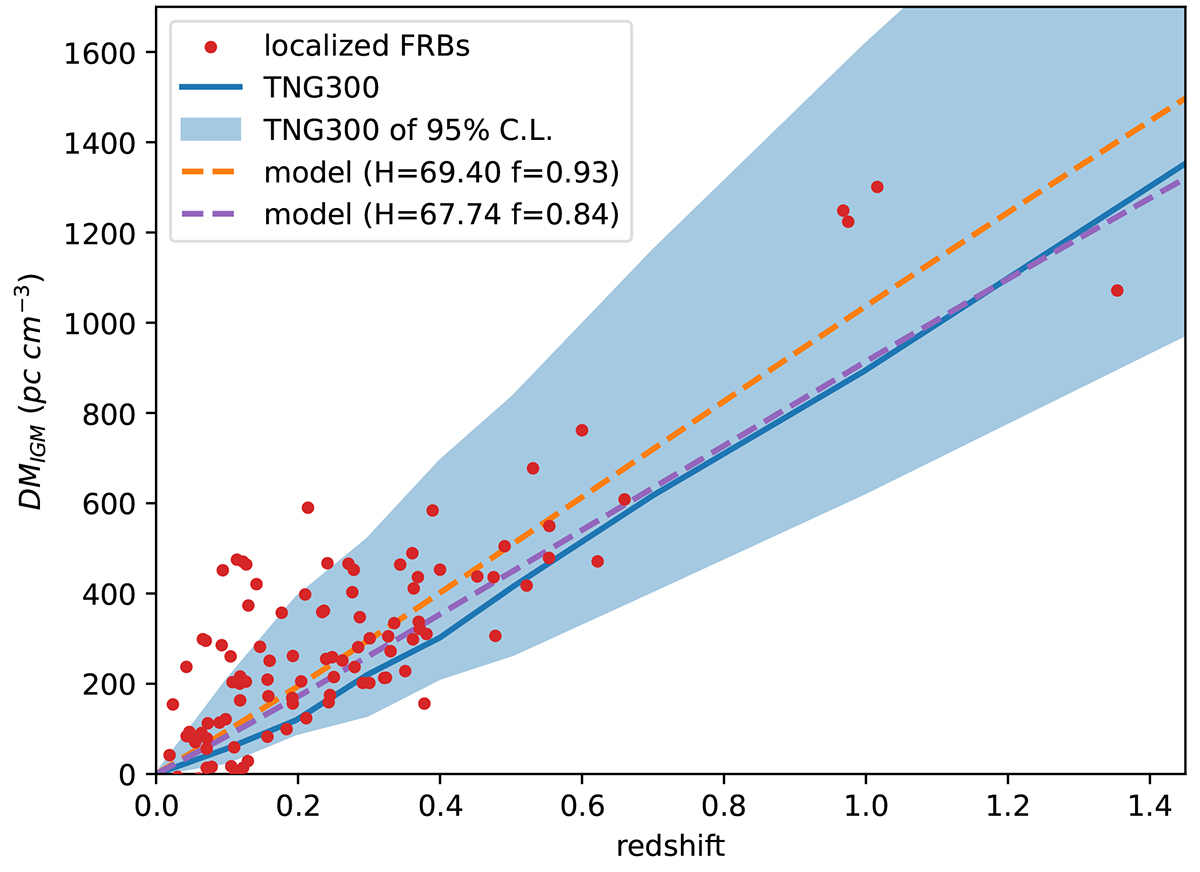
DMIGM-z relation for localized FRBs. The red dots show localized FRBs. The blue line corresponds to the DMIGM from the IllustrisTNG 300 simulation, and the blue shaded area is the 95% confidence region. The dashed orange and purple lines represent the models in Equation (5) with different parameters (H0 and fIGM). 〈DMIGM〉 = DMexc–〈DMhost〉, where 〈DMhost〉 is given by the IllustrisTNG simulation.
Current usage metrics show cumulative count of Article Views (full-text article views including HTML views, PDF and ePub downloads, according to the available data) and Abstracts Views on Vision4Press platform.
Data correspond to usage on the plateform after 2015. The current usage metrics is available 48-96 hours after online publication and is updated daily on week days.
Initial download of the metrics may take a while.