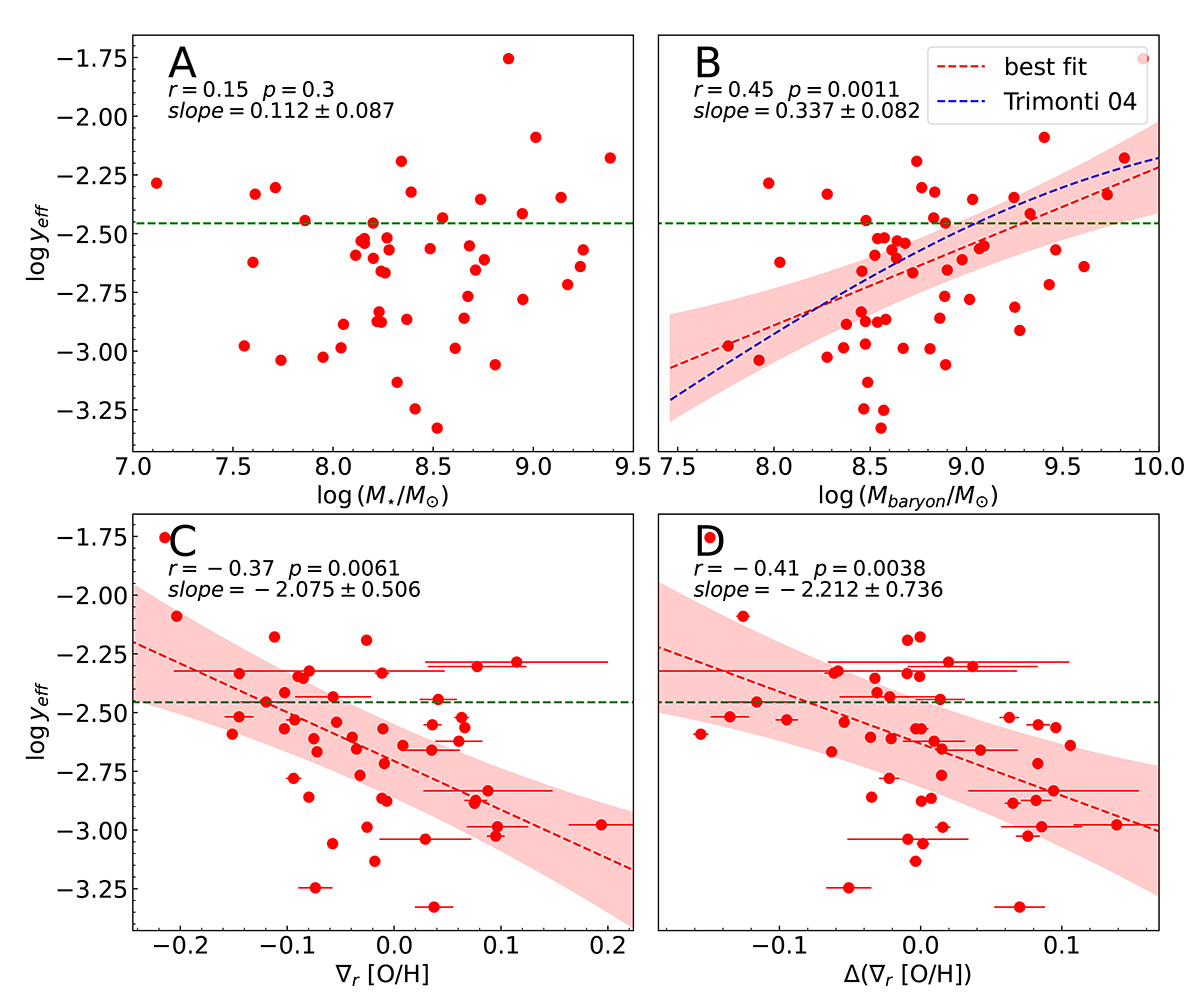
Fig. 8.
Download original image
Panels A, B, C, and D show the relation between effective yield and stellar mass, total baryonic mass (stellar+neutral atomic mass), metallicity gradient and residual metallicity gradient (after removing the stellar mass dependence). In each panel the green dashed horizontal line represents the true stellar oxygen yield derived by Pilyugin et al. (2007), and the red dashed line and the shaded region are the best-fit linear relation and its 1σ uncertainties. The Spearman’s rank correlation coefficient r, p-value and the best-fit slope are given in the upper left corner of each panel. In panel B we also plot the best-fit relation from Tremonti et al. (2004).
Current usage metrics show cumulative count of Article Views (full-text article views including HTML views, PDF and ePub downloads, according to the available data) and Abstracts Views on Vision4Press platform.
Data correspond to usage on the plateform after 2015. The current usage metrics is available 48-96 hours after online publication and is updated daily on week days.
Initial download of the metrics may take a while.