Fig. 7.
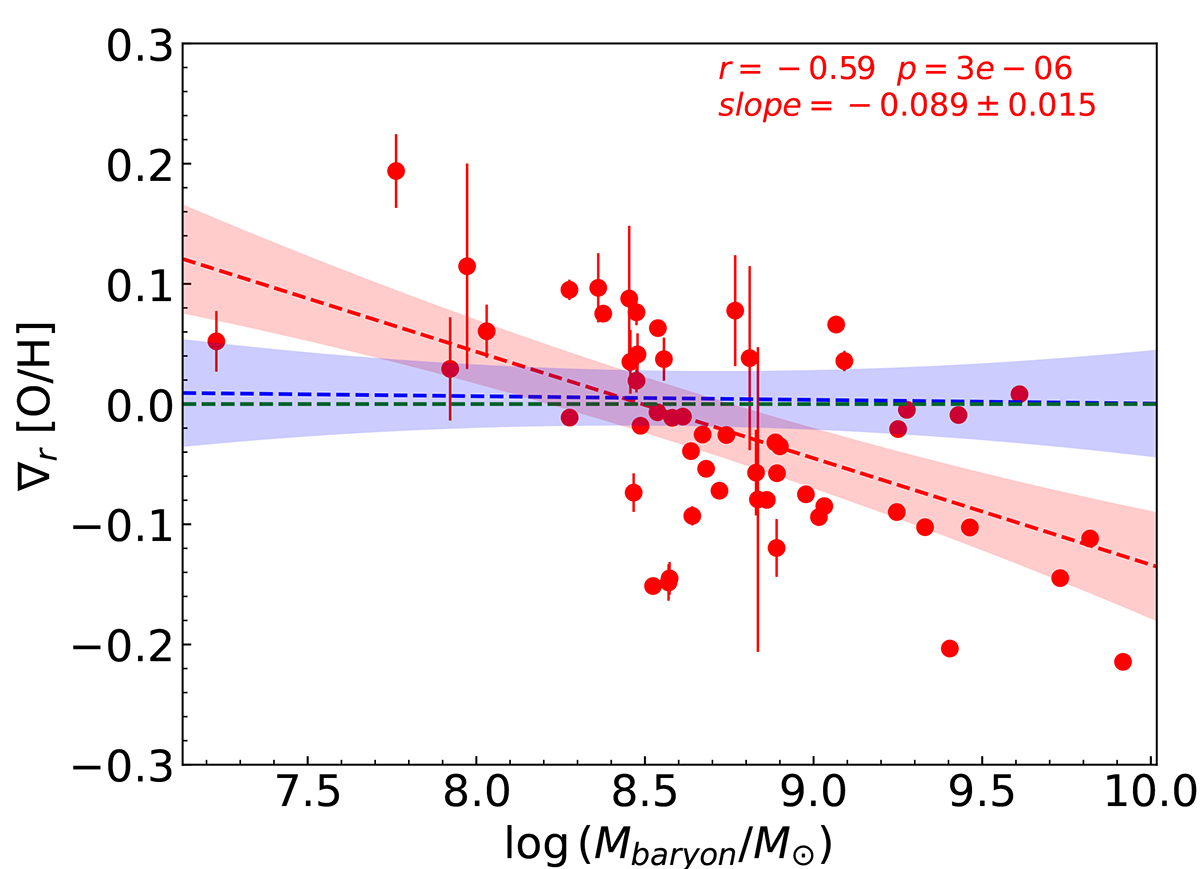
Download original image
Metallicity gradient as a function of the total baryonic mass. The red circles represent the galaxies measured in this work. The red dashed line and shaded region represent the best-fit linear relation and its 1σ uncertainties. The blue dashed line represents the best-fit linear relation between the residual metallicity gradient (after removing the stellar mass dependence) and the baryonic mass, and the blue shaded region represents 1σ uncertainties of the best-fit relation, with the slope shown in blue. The green horizontal dashed line marks a metallicity gradient of 0.
Current usage metrics show cumulative count of Article Views (full-text article views including HTML views, PDF and ePub downloads, according to the available data) and Abstracts Views on Vision4Press platform.
Data correspond to usage on the plateform after 2015. The current usage metrics is available 48-96 hours after online publication and is updated daily on week days.
Initial download of the metrics may take a while.