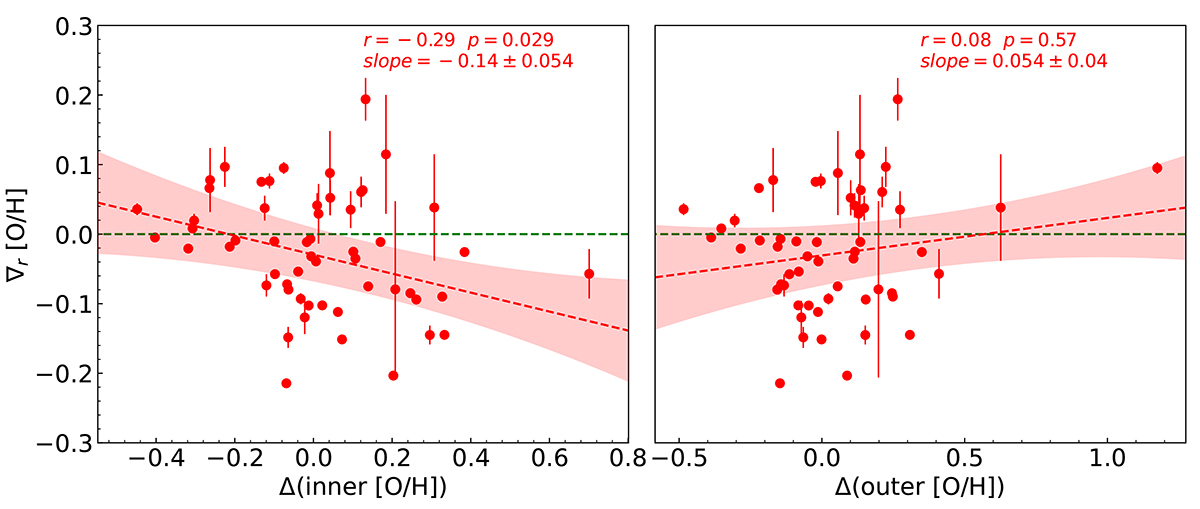
Fig. 4.
Download original image
Residual metallicity vs. metallicity gradient. Each circle presents one single galaxy in our sample, and the red shaded region represents 1σ uncertainties of the best-fit relation; the slope is shown as a red dashed line. In both panels the X-axis represents the metallicity residual of the inner region or outer region of the galaxy in the left or right panel, respectively. The results of best linear fit are shown in the upper right corner in each panel.
Current usage metrics show cumulative count of Article Views (full-text article views including HTML views, PDF and ePub downloads, according to the available data) and Abstracts Views on Vision4Press platform.
Data correspond to usage on the plateform after 2015. The current usage metrics is available 48-96 hours after online publication and is updated daily on week days.
Initial download of the metrics may take a while.