Fig. 2.

Download original image
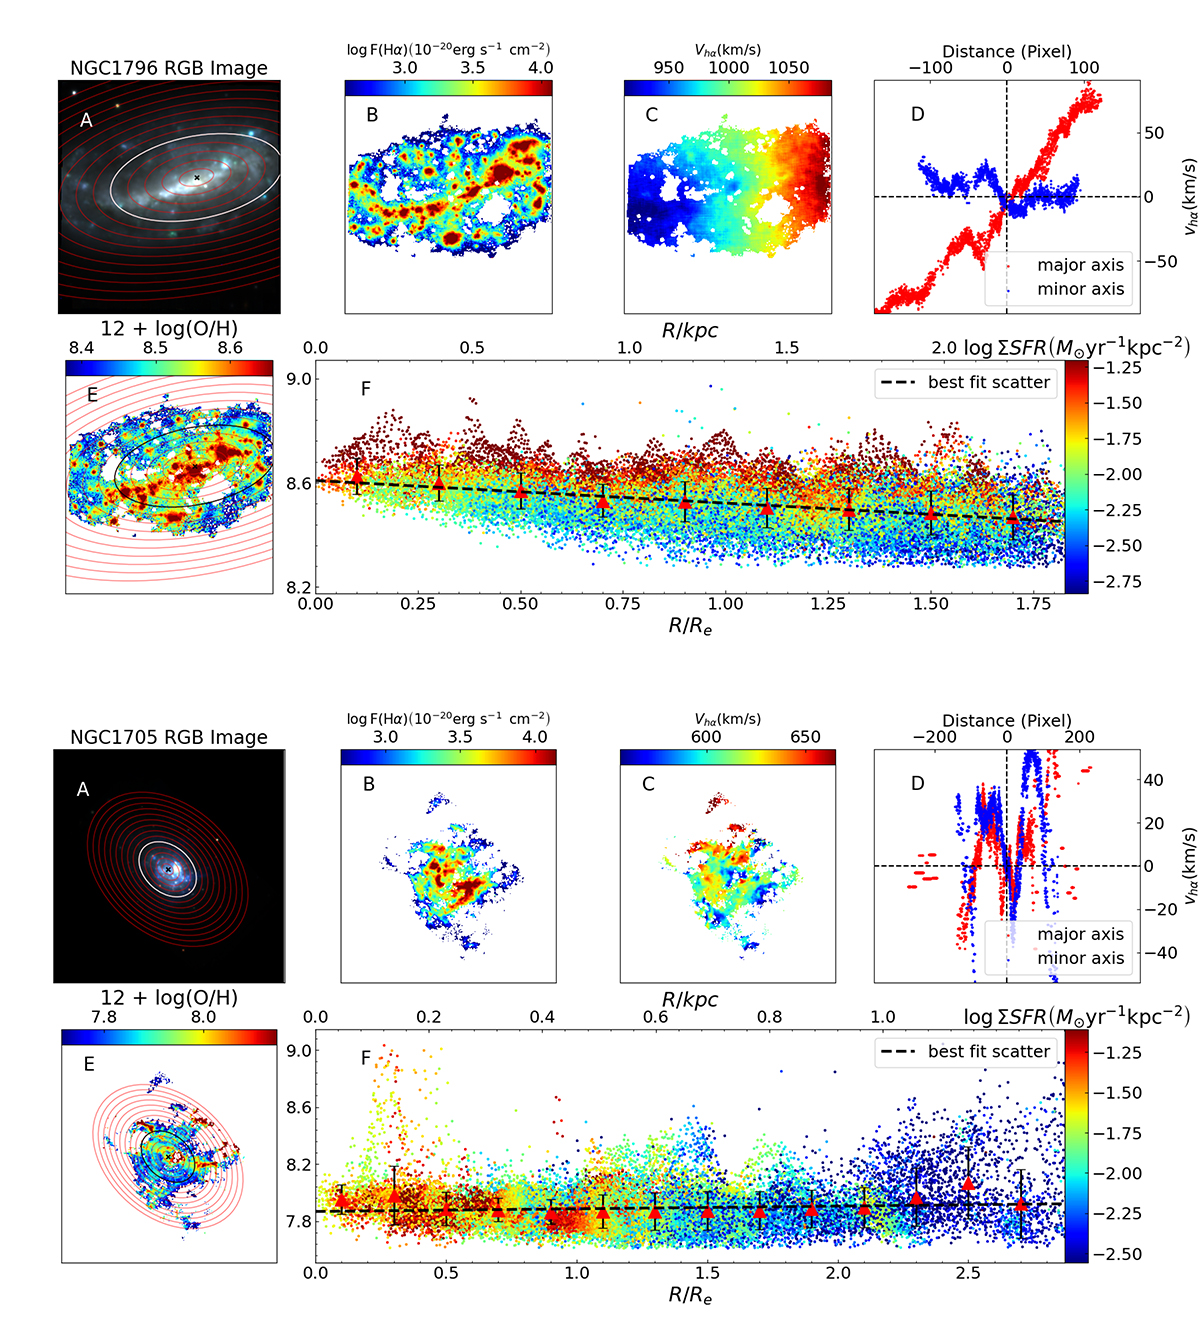
Galaxies NGC 1796 and NGC 1705 as examples of our working sample. From top left to bottom right for each galaxy: three-color composite image (A) based on synthetic V, I, and R band images obtained from the MUSE cubes, overplotted with the isophotal ellipses of galaxy in a 0.2Re interval (the white ellipse represents 1Re); the Hα emission-line map (B) and its velocity field (C); the Hα velocity along the major or minor axis (D); the 12+log(O/H) map (E); and its distribution as a function of galactocentric radius (F). In panel F, the data points are color-coded by SFR, and the red triangles are the median values for each 0.2Re interval, with error bars denoting the standard deviation. The dashed line corresponds to the best-fit linear relation of the data points. Similar figures for the other galaxies in our sample can be found at https://github.com/Count-Lee/metallicity-gradient.
Current usage metrics show cumulative count of Article Views (full-text article views including HTML views, PDF and ePub downloads, according to the available data) and Abstracts Views on Vision4Press platform.
Data correspond to usage on the plateform after 2015. The current usage metrics is available 48-96 hours after online publication and is updated daily on week days.
Initial download of the metrics may take a while.


