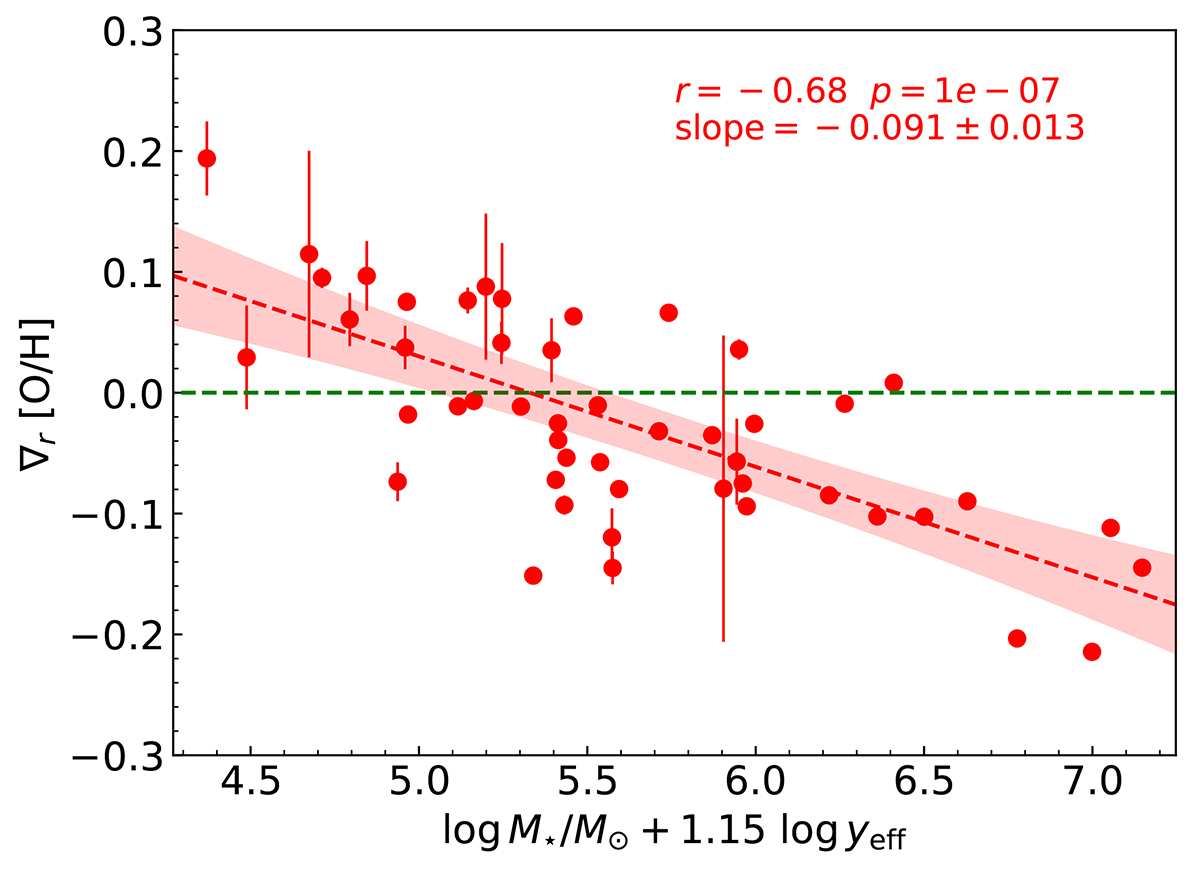
Fig. 13.
Download original image
Relation between metallicity gradients and μ1.15 = log M⋆/M⊙ + 1.15 × log yeff. The coefficient of log yeff, α = 1.15, minimizes the scatter of metallicity gradients at given μ1.15. The best-fit slope, Spearman’s rank correlation r and p-value are given in the upper right corner of this figure. The red dashed line and shaded region represent the best-fit linear relation and its 1σ uncertainties. The combination parameter μ1.15 exhibits a strong correlation with metallicity gradients, and represents the tightest correlation observed with metallicity gradients (see Sect. 3.5 for details).
Current usage metrics show cumulative count of Article Views (full-text article views including HTML views, PDF and ePub downloads, according to the available data) and Abstracts Views on Vision4Press platform.
Data correspond to usage on the plateform after 2015. The current usage metrics is available 48-96 hours after online publication and is updated daily on week days.
Initial download of the metrics may take a while.