Fig. 11.
Download original image
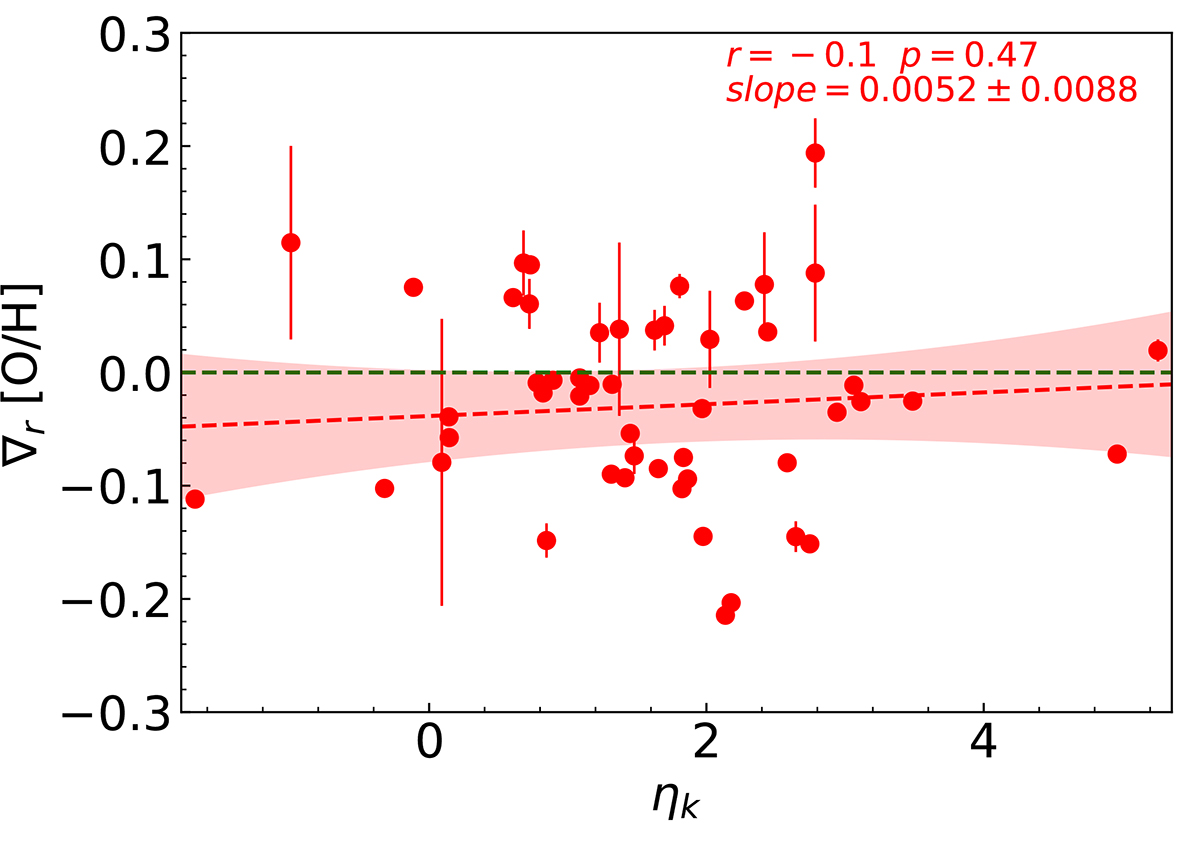
Metallicity gradients as a function of the projected local number density of galaxies. Circles represent individual galaxies, and the red shaded region represents 1σ uncertainties of the best-fit relation. The slope is shown as a red dashed line. The Spearman correlation coefficient and best-fit slope are given in the upper right corner.
Current usage metrics show cumulative count of Article Views (full-text article views including HTML views, PDF and ePub downloads, according to the available data) and Abstracts Views on Vision4Press platform.
Data correspond to usage on the plateform after 2015. The current usage metrics is available 48-96 hours after online publication and is updated daily on week days.
Initial download of the metrics may take a while.