Fig. 10.
Download original image
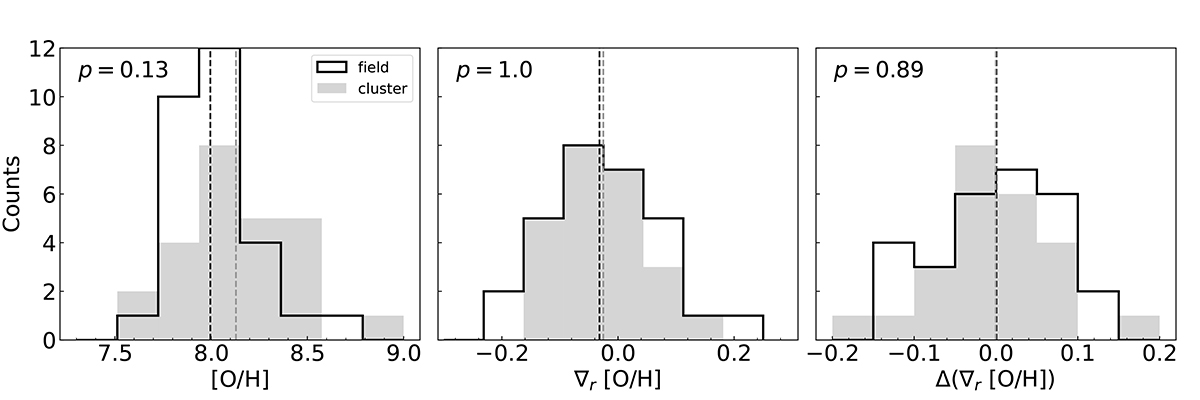
Environmental dependence of the metallicity, metallicity gradient and metallicity gradient residual (obtained by removing the best-fit linear relation between gradient and stellar mass) distributions. The gray shaded histograms represent the cluster subsample, and the open histograms represent the field subsample. The vertical black (gray) dashed line marks the median values of field (cluster) subsample. The value in the upper left corner corresponds to the p-value from the Kolmogorov-Smirnov tests conducted between galaxies in different environments.
Current usage metrics show cumulative count of Article Views (full-text article views including HTML views, PDF and ePub downloads, according to the available data) and Abstracts Views on Vision4Press platform.
Data correspond to usage on the plateform after 2015. The current usage metrics is available 48-96 hours after online publication and is updated daily on week days.
Initial download of the metrics may take a while.