Fig. 1.
Download original image
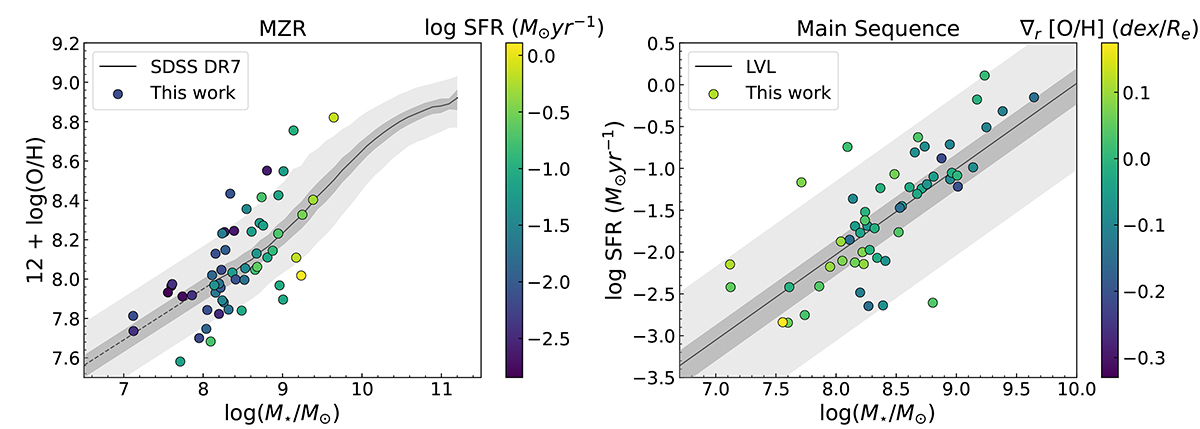
Mass−metallicity relation (left panel) and star formation main sequence (right panel) of our galaxy sample (circles color-coded by SFR in the left panel and by gas-phase metallicity gradient in the right panel) in comparison with the distribution of SDSS galaxies and LVL galaxies. The solid or dashed lines represent the median trend or linear fit; the shaded regions indicate one and two standard deviations from the median trend. The metallicity is derived using N2S2Hα method (See Sect. 3.1 for details).
Current usage metrics show cumulative count of Article Views (full-text article views including HTML views, PDF and ePub downloads, according to the available data) and Abstracts Views on Vision4Press platform.
Data correspond to usage on the plateform after 2015. The current usage metrics is available 48-96 hours after online publication and is updated daily on week days.
Initial download of the metrics may take a while.