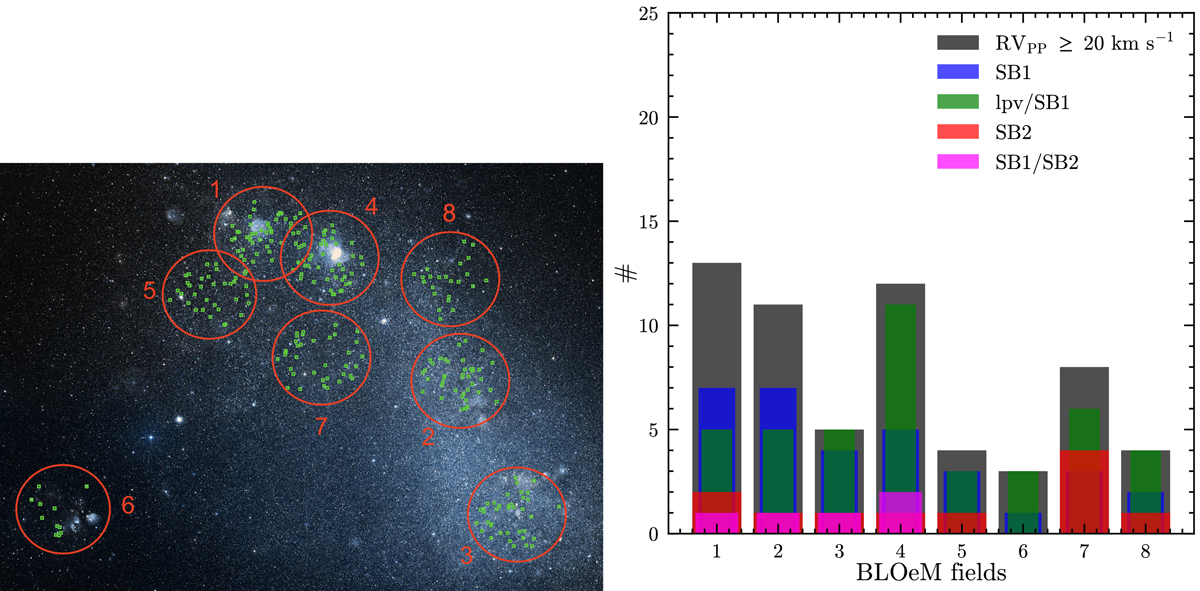
Fig. 8.
Download original image
Left panel: Spatial distribution of investigated BSG sample in each BLOeM field superposed on Digitized Sky Survey image of the SMC (STScI/NASA, Colored & Healpixed by CDS). Right panel: Number of BSGs with various binary status for each BLOeM field. The number of targets with RVPP > 20 km s−1 is not connected with the number of targets visually classified as spectroscopic binaries.
Current usage metrics show cumulative count of Article Views (full-text article views including HTML views, PDF and ePub downloads, according to the available data) and Abstracts Views on Vision4Press platform.
Data correspond to usage on the plateform after 2015. The current usage metrics is available 48-96 hours after online publication and is updated daily on week days.
Initial download of the metrics may take a while.