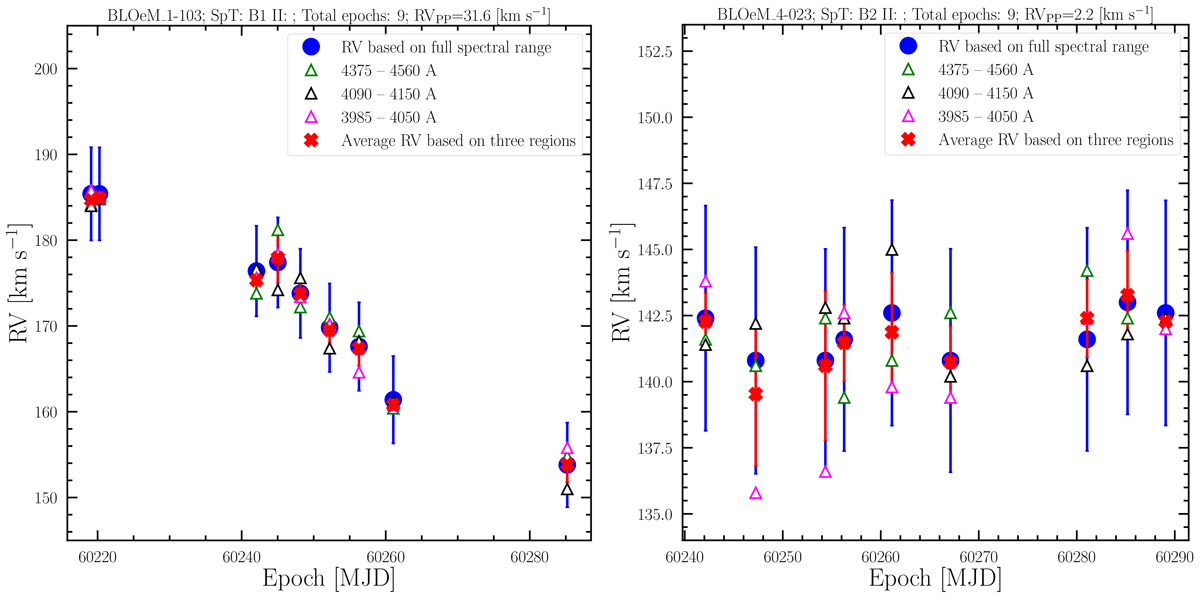
Fig. 3.
Download original image
Example of individual radial velocity measurements by using a cross-correlation technique based on different wavelength ranges for the SB1 system (left panel, BLOeM 1-103) and an apparently single BSG with small RV variation (right panel: BLOeM 4-023, noting that the ordinate axis is significantly zoomed-in). Blue error bars represent the standard deviation of measurements based on the cross-correlation of the entire wavelength range and the red error bars represent the standard deviation of mean radial velocity based on the three different wavelength pieces.
Current usage metrics show cumulative count of Article Views (full-text article views including HTML views, PDF and ePub downloads, according to the available data) and Abstracts Views on Vision4Press platform.
Data correspond to usage on the plateform after 2015. The current usage metrics is available 48-96 hours after online publication and is updated daily on week days.
Initial download of the metrics may take a while.