Open Access
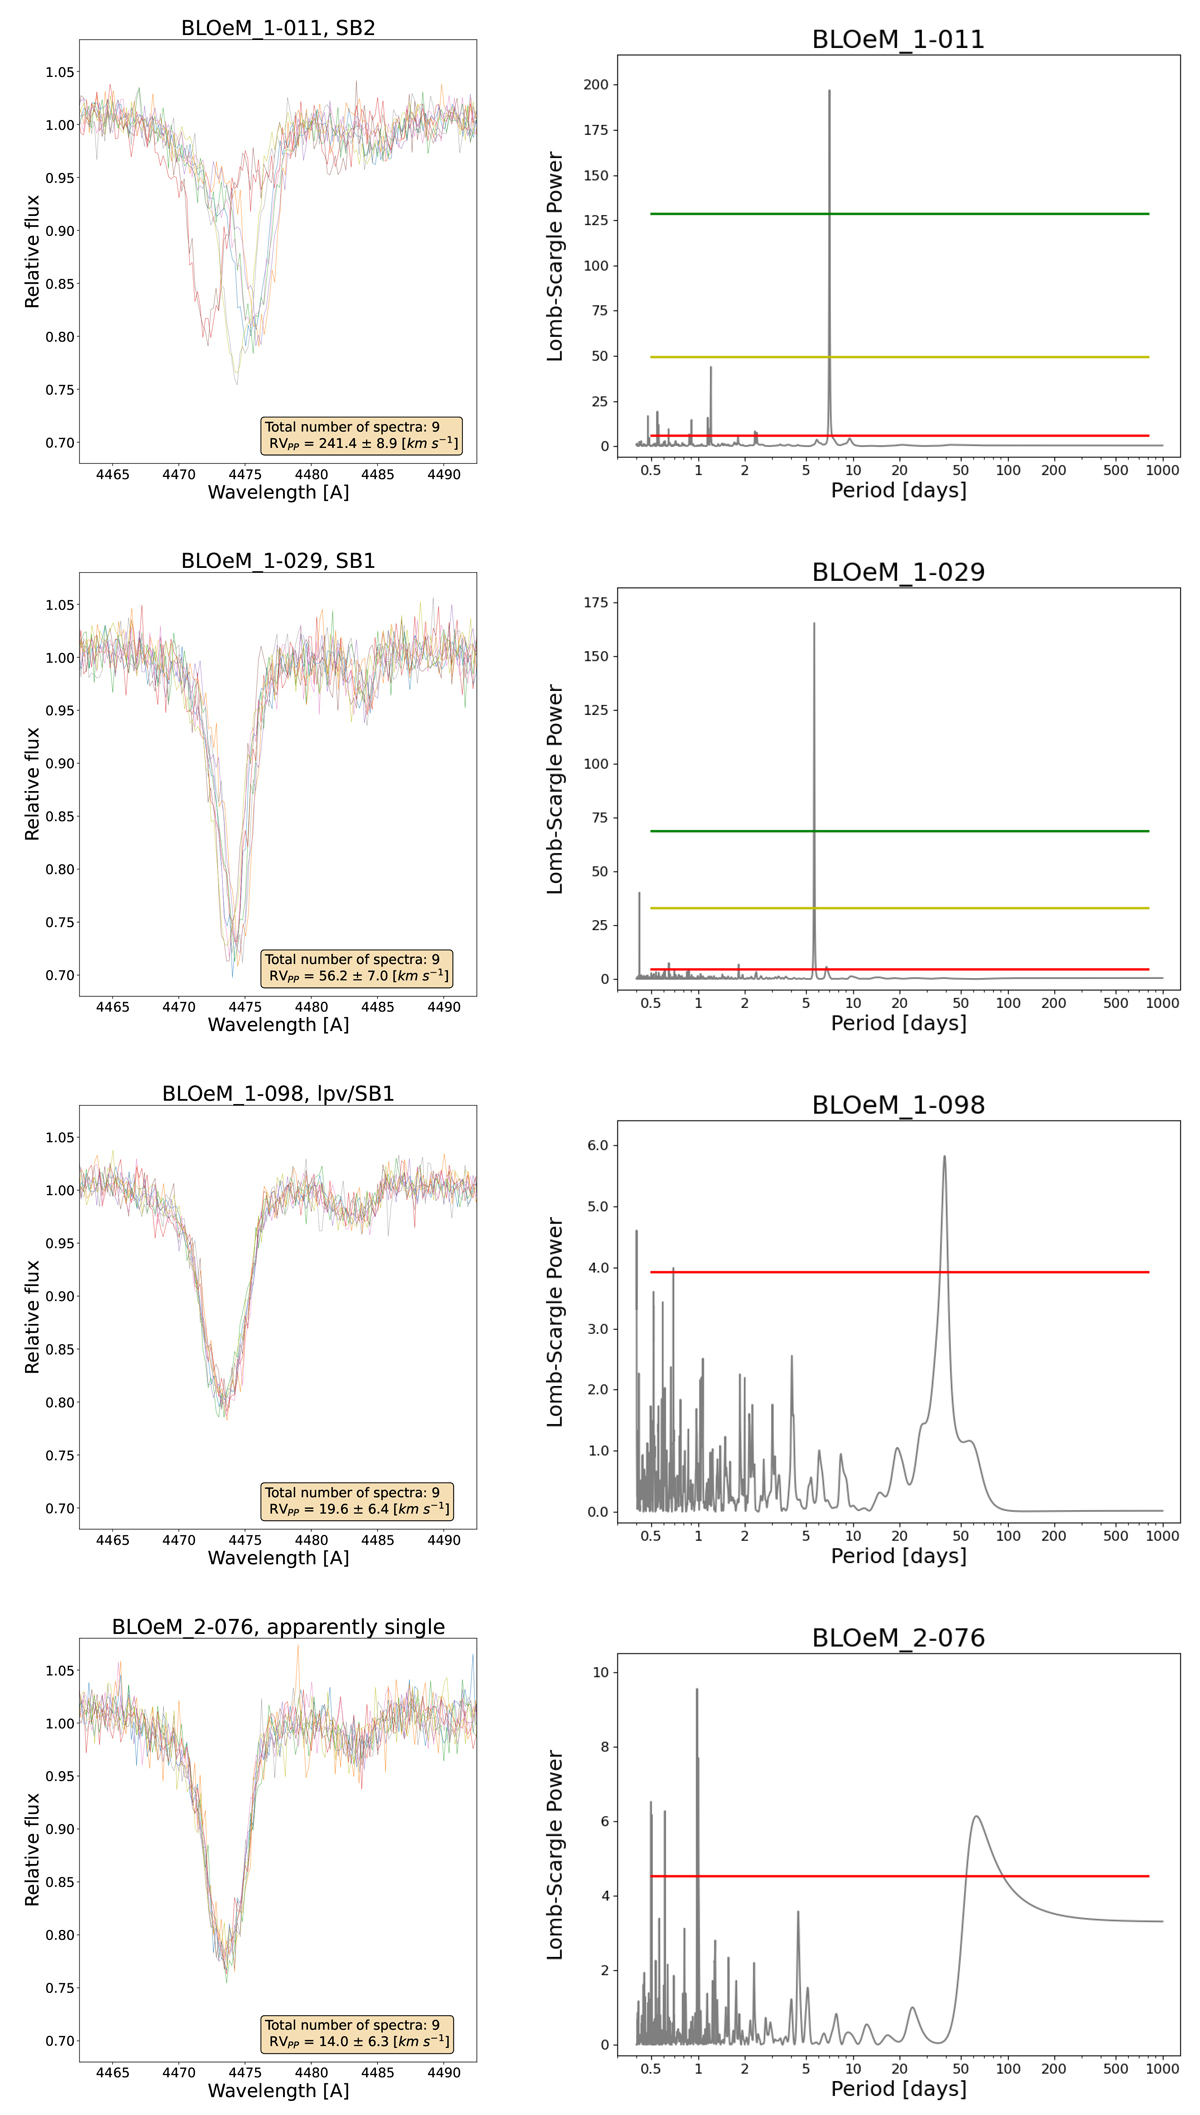
Fig. A.3.
Download original image
Example of line profile variability for targets which we classified as SB2, SB1, lpv/SB1, and apparently single (left panels) and corresponded LS periodograms (right panels). Dashed horizontal lines on the LS periodograms represent different false-alarm levels namely, 0.1% – green line, 1% – yellow line, 50% – red line.
Current usage metrics show cumulative count of Article Views (full-text article views including HTML views, PDF and ePub downloads, according to the available data) and Abstracts Views on Vision4Press platform.
Data correspond to usage on the plateform after 2015. The current usage metrics is available 48-96 hours after online publication and is updated daily on week days.
Initial download of the metrics may take a while.