Open Access
Fig. A.2.
Download original image
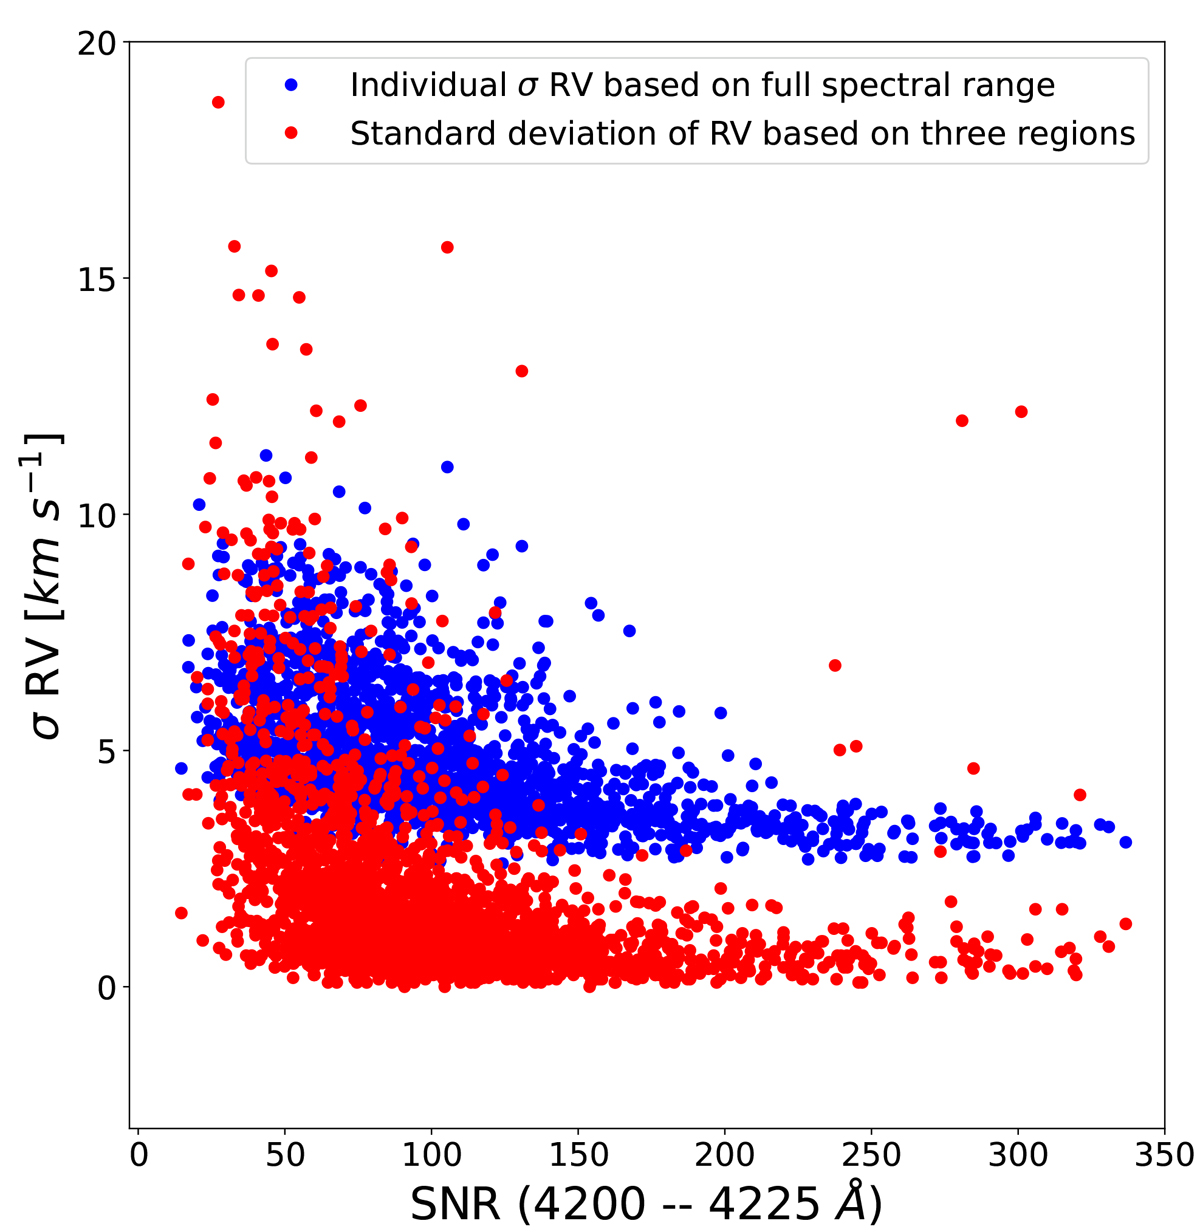
Individual uncertainties of RV based on the cross-correlation of full spectral range (blue dots) and standard deviation of the mean RV based on individual RV derived from three different wavelength regions (red dots) as a function of S/N for each analyzed spectrum.
Current usage metrics show cumulative count of Article Views (full-text article views including HTML views, PDF and ePub downloads, according to the available data) and Abstracts Views on Vision4Press platform.
Data correspond to usage on the plateform after 2015. The current usage metrics is available 48-96 hours after online publication and is updated daily on week days.
Initial download of the metrics may take a while.