Fig. 7.
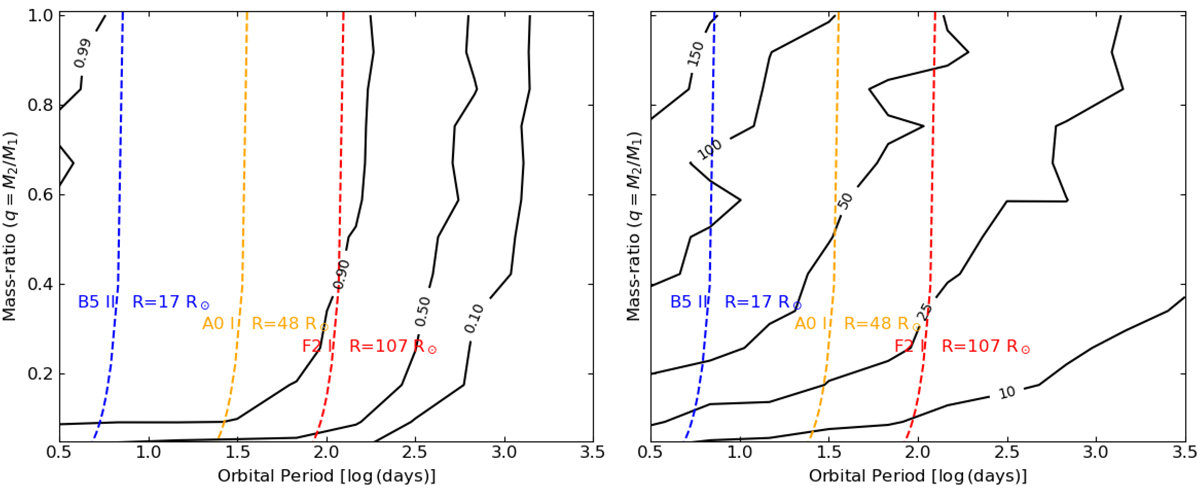
Download original image
Left: Orbital period shown against mass ratio (q) for simulated binary systems in the orbital period ranges that were used to correct for our observational biases. Solid black contour lines show the probability of detection at the 99, 90, 50, and 10% levels given the temporal baseline and typical uncertainties of the BLOeM data, where each grid point is the median of 10 000 simulated systems. The detection criteria used in these simulations are matched to those of the observations (i.e. Δv = 5 km s−1 and σ = 4). The dashed coloured lines show the minimum allowed orbital period for three representative examples as a function of the mass ratio of the system. Right: Same simulations where the solid contour lines now show lines of constant semi-amplitude velocity on the 150, 100, 50, 25, and 10 km s−1 levels.
Current usage metrics show cumulative count of Article Views (full-text article views including HTML views, PDF and ePub downloads, according to the available data) and Abstracts Views on Vision4Press platform.
Data correspond to usage on the plateform after 2015. The current usage metrics is available 48-96 hours after online publication and is updated daily on week days.
Initial download of the metrics may take a while.