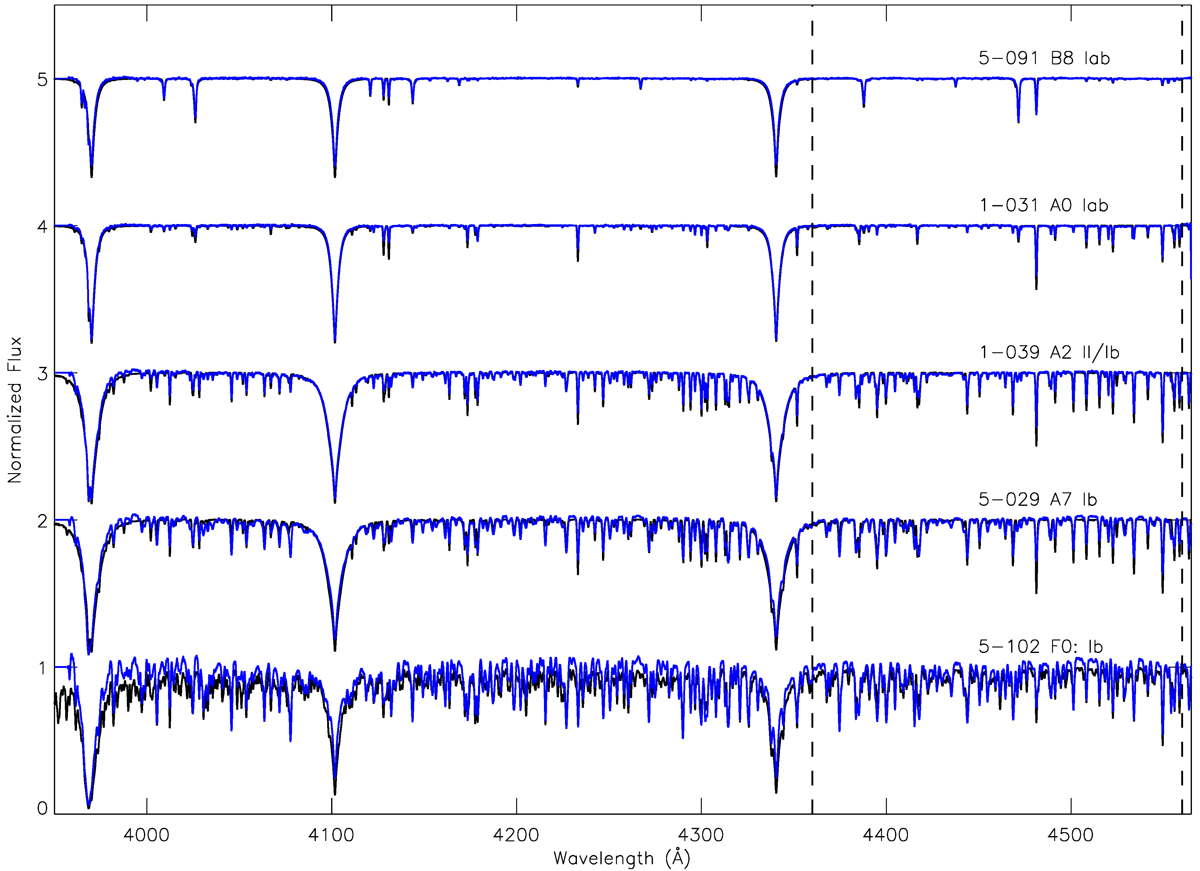
Fig. 3.
Download original image
A montage of BAF supergiant star spectra from BLOeM (in black) and best matching theoretical template spectra (blue) from CMFGEN/ATLAS model grids (see text). BLOeM IDs and spectral types are noted above each spectrum. Template spectra were used to determine an absolute RV scale, and one can see good agreement between line positions and strengths of the templates with the data. The vertical dashed lines indicate the spectral region that was used to derive the cross-correlation functions (CCFs) for all sources. We highlight the slight mismatch of the continuum for the F supergiant, BLOeM 1-102. For cool stars, the automatic continuum placement is more difficult due to the line density of the spectra; however, the CCFs are not impacted by this offset as we use normalised CCFs, such that the mean signal is subtracted from each spectrum before cross-correlation. We note that the A–F supergiant line spectra are dominated by Fe II and Fe I lines (for line lists, see Venn 1995, 1999).
Current usage metrics show cumulative count of Article Views (full-text article views including HTML views, PDF and ePub downloads, according to the available data) and Abstracts Views on Vision4Press platform.
Data correspond to usage on the plateform after 2015. The current usage metrics is available 48-96 hours after online publication and is updated daily on week days.
Initial download of the metrics may take a while.