Open Access
Fig. 2.
Download original image
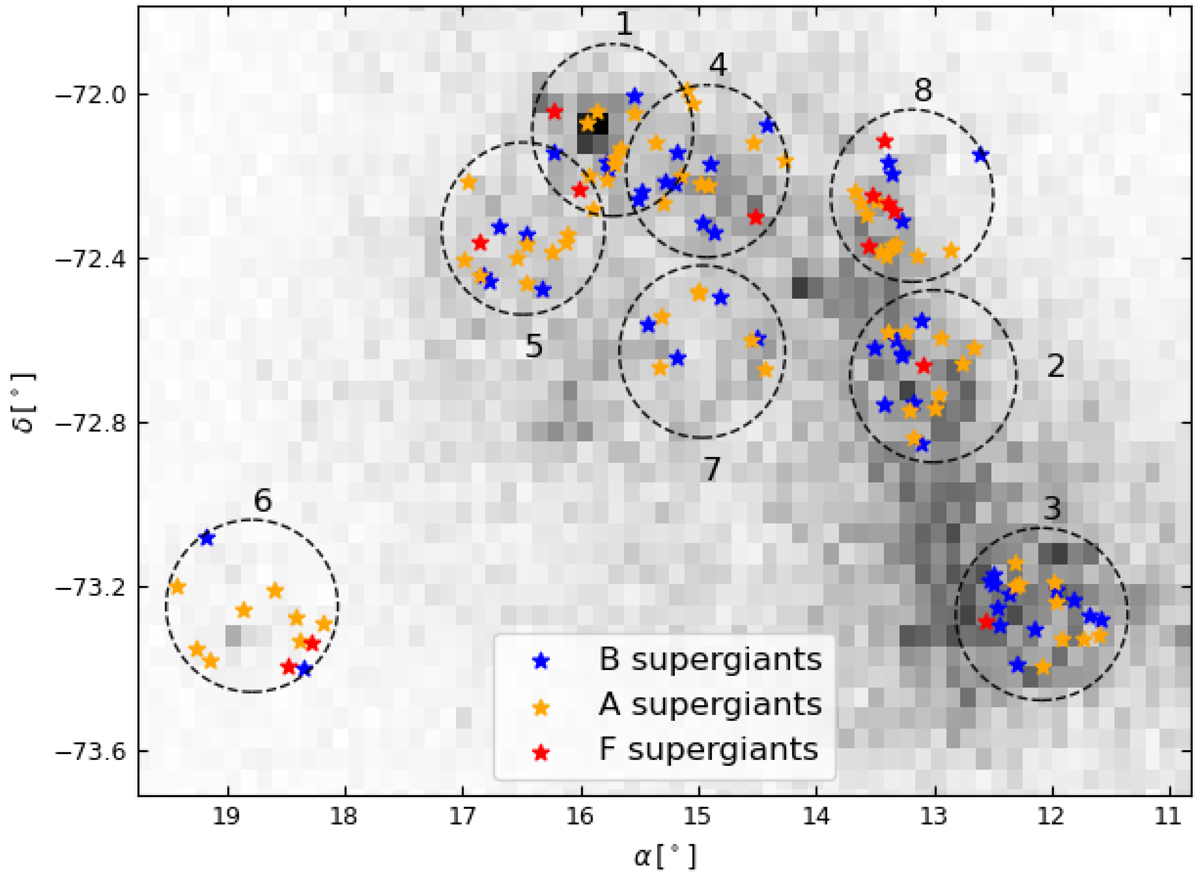
Spatial location of the BAF-type supergiant sample in the SMC, overlaid on the density map of the Gaia DR3 source catalogue (G < 19 mag). Spectral types of the targets are colour-coded as indicated. Black circles mark the locations of the eight BLOeM fields.
Current usage metrics show cumulative count of Article Views (full-text article views including HTML views, PDF and ePub downloads, according to the available data) and Abstracts Views on Vision4Press platform.
Data correspond to usage on the plateform after 2015. The current usage metrics is available 48-96 hours after online publication and is updated daily on week days.
Initial download of the metrics may take a while.