Open Access
Fig. C.1.
Download original image
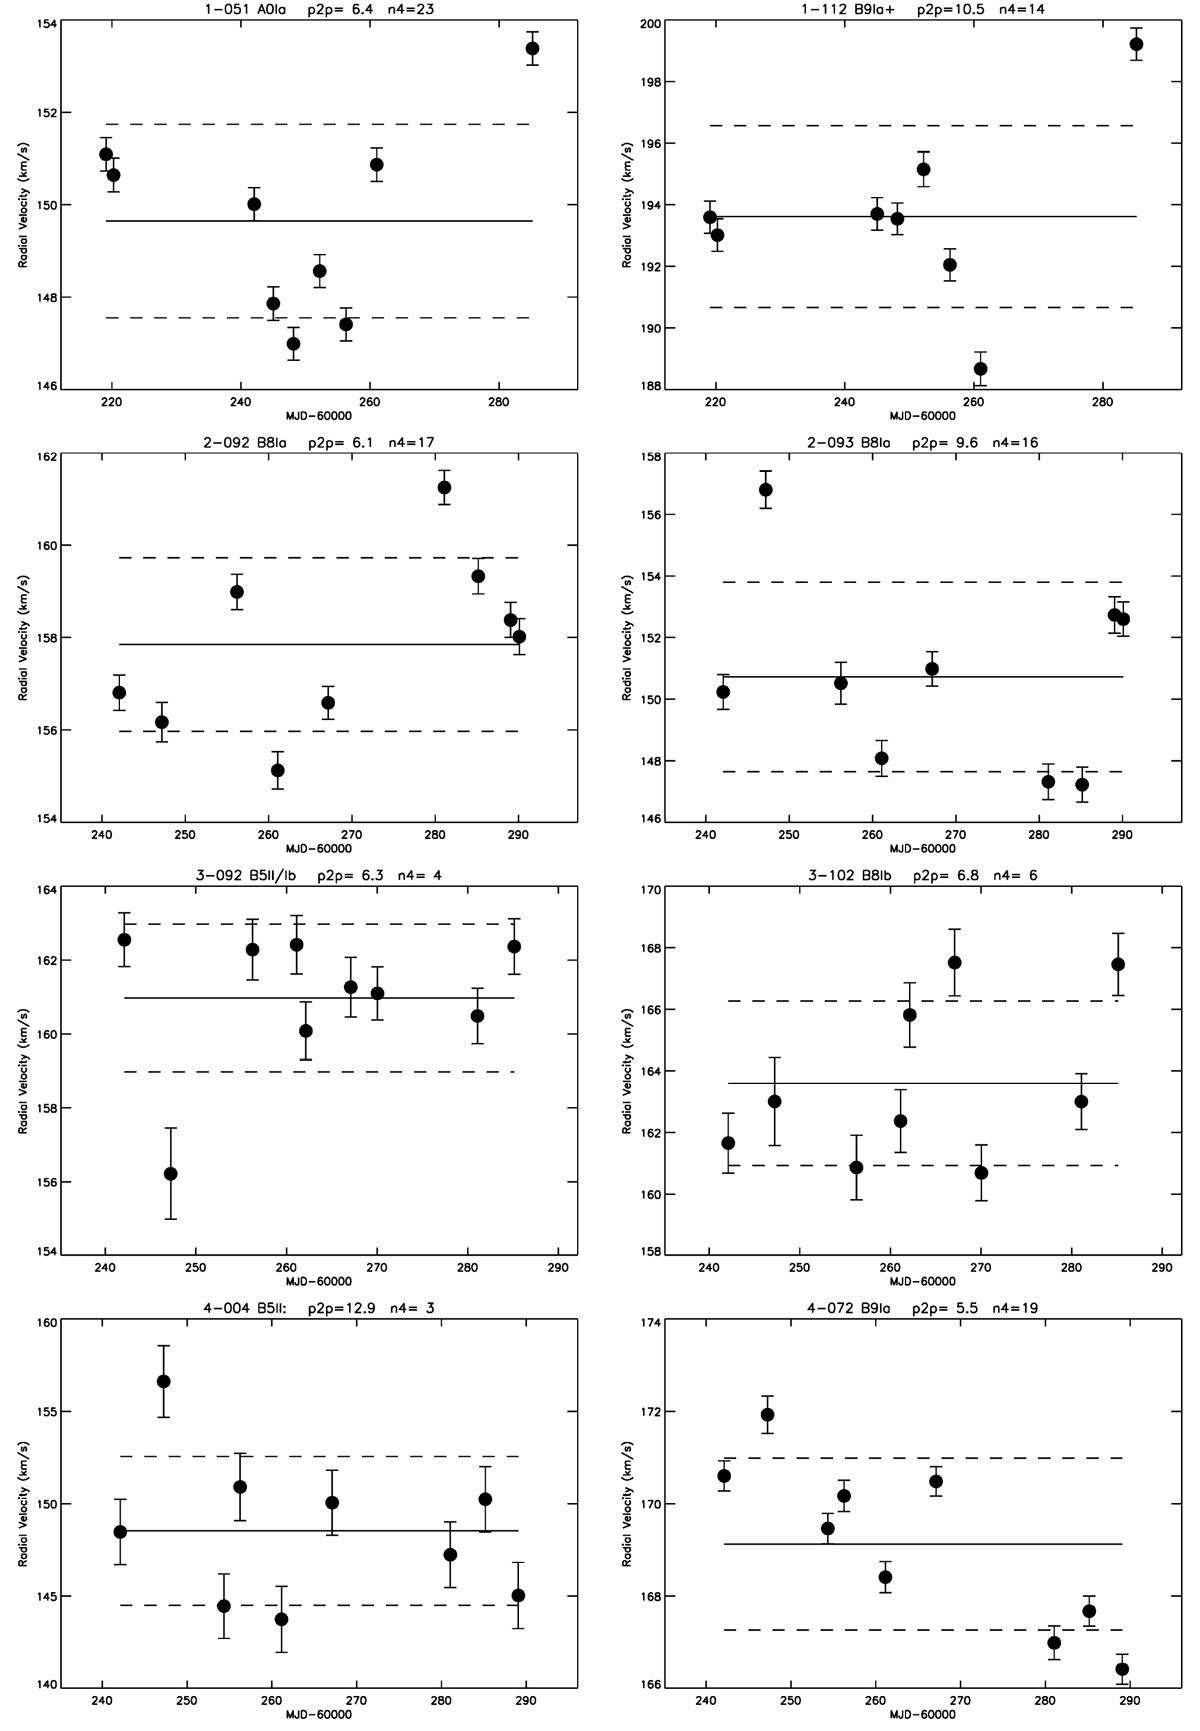
Radial velocity plots as function MJD for sources flagged as var in Table B.3. Headers give the BLOeM identifiers, spectra types, peak-to-peak velocities, and number of velocity pairs satisfying Eq. (1). The horizontal solid lines indicate the mean velocities, and the dashed lines the standard deviations.
Current usage metrics show cumulative count of Article Views (full-text article views including HTML views, PDF and ePub downloads, according to the available data) and Abstracts Views on Vision4Press platform.
Data correspond to usage on the plateform after 2015. The current usage metrics is available 48-96 hours after online publication and is updated daily on week days.
Initial download of the metrics may take a while.