Open Access
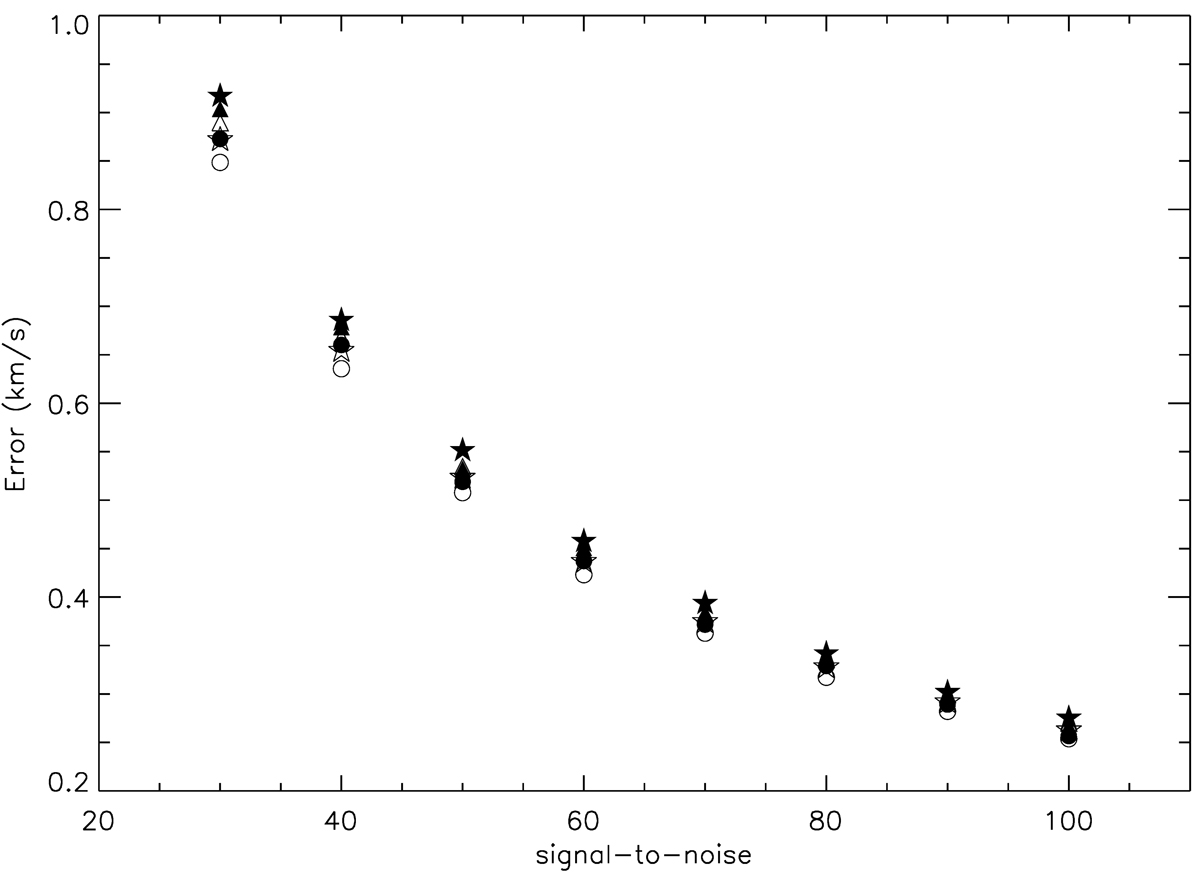
Fig. A.2.
Download original image
Cross-correlation error versus signal-to-noise for a simulated BLOeM spectrum: Filled symbols indicate results from the Monte Carlo simulation, open symbols are results derived from Eq. (A.1) modified as discussed in the test. Triangles, circles and stars denote resampled pixel sizes of 14, 7 and 1km s−1 respectively.
Current usage metrics show cumulative count of Article Views (full-text article views including HTML views, PDF and ePub downloads, according to the available data) and Abstracts Views on Vision4Press platform.
Data correspond to usage on the plateform after 2015. The current usage metrics is available 48-96 hours after online publication and is updated daily on week days.
Initial download of the metrics may take a while.