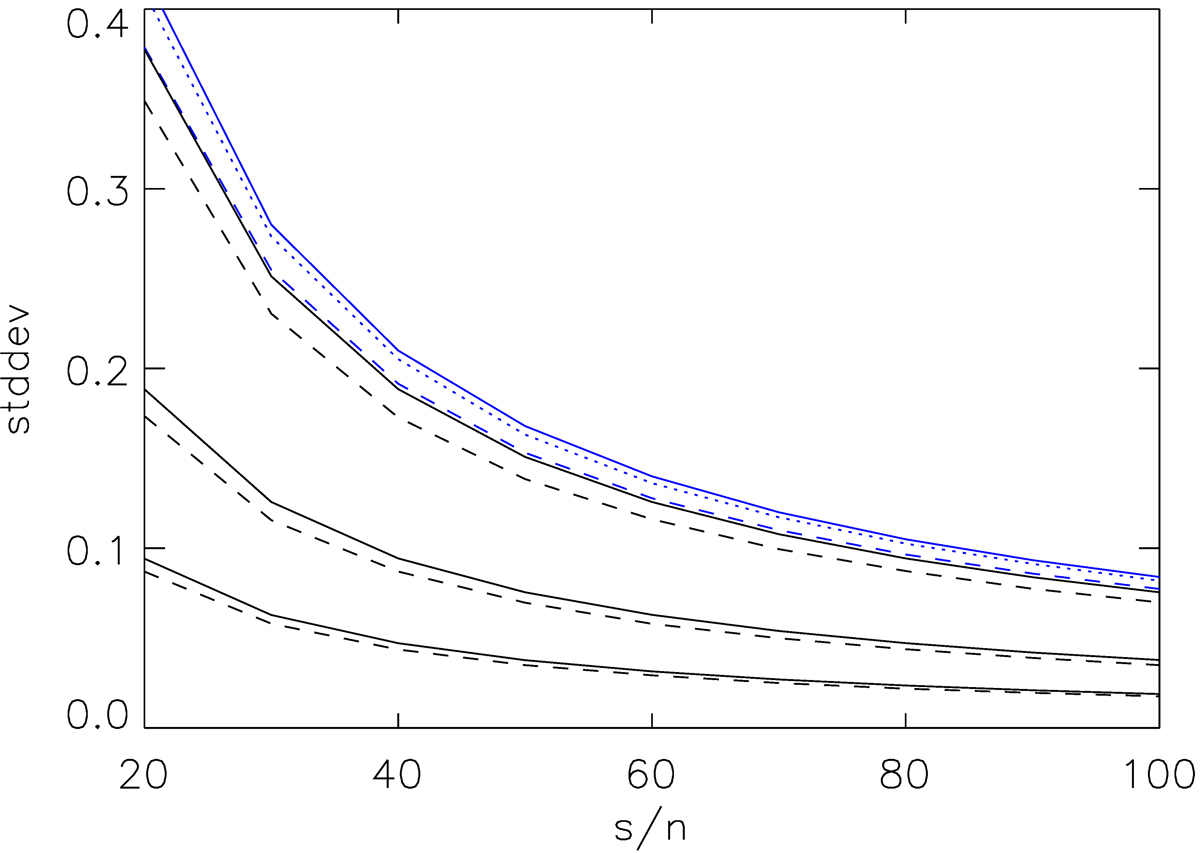
Fig. A.1.
Download original image
Dashed black lines – plot of errors (stddev) of CCF positions versus signal-to-noise obtained in 105 simulations of simple spectra consisting of 1, 4 and 16 absorption lines (ordering is top to bottom). Solid black lines – expected trends due to Eq. (A.1) which is larger by approximately 8%. Note that the errors halve for each increase in the number of lines by a factor of 4. Blue lines are the equivalent results for a template A-supergiant spectrum, with the dotted line illustrating the explicit errors obtained from the simulation of Gaussian noise. The dashed blue line has been shifted upwards by 0.02 units for clarity.
Current usage metrics show cumulative count of Article Views (full-text article views including HTML views, PDF and ePub downloads, according to the available data) and Abstracts Views on Vision4Press platform.
Data correspond to usage on the plateform after 2015. The current usage metrics is available 48-96 hours after online publication and is updated daily on week days.
Initial download of the metrics may take a while.