Fig. 6
Download original image
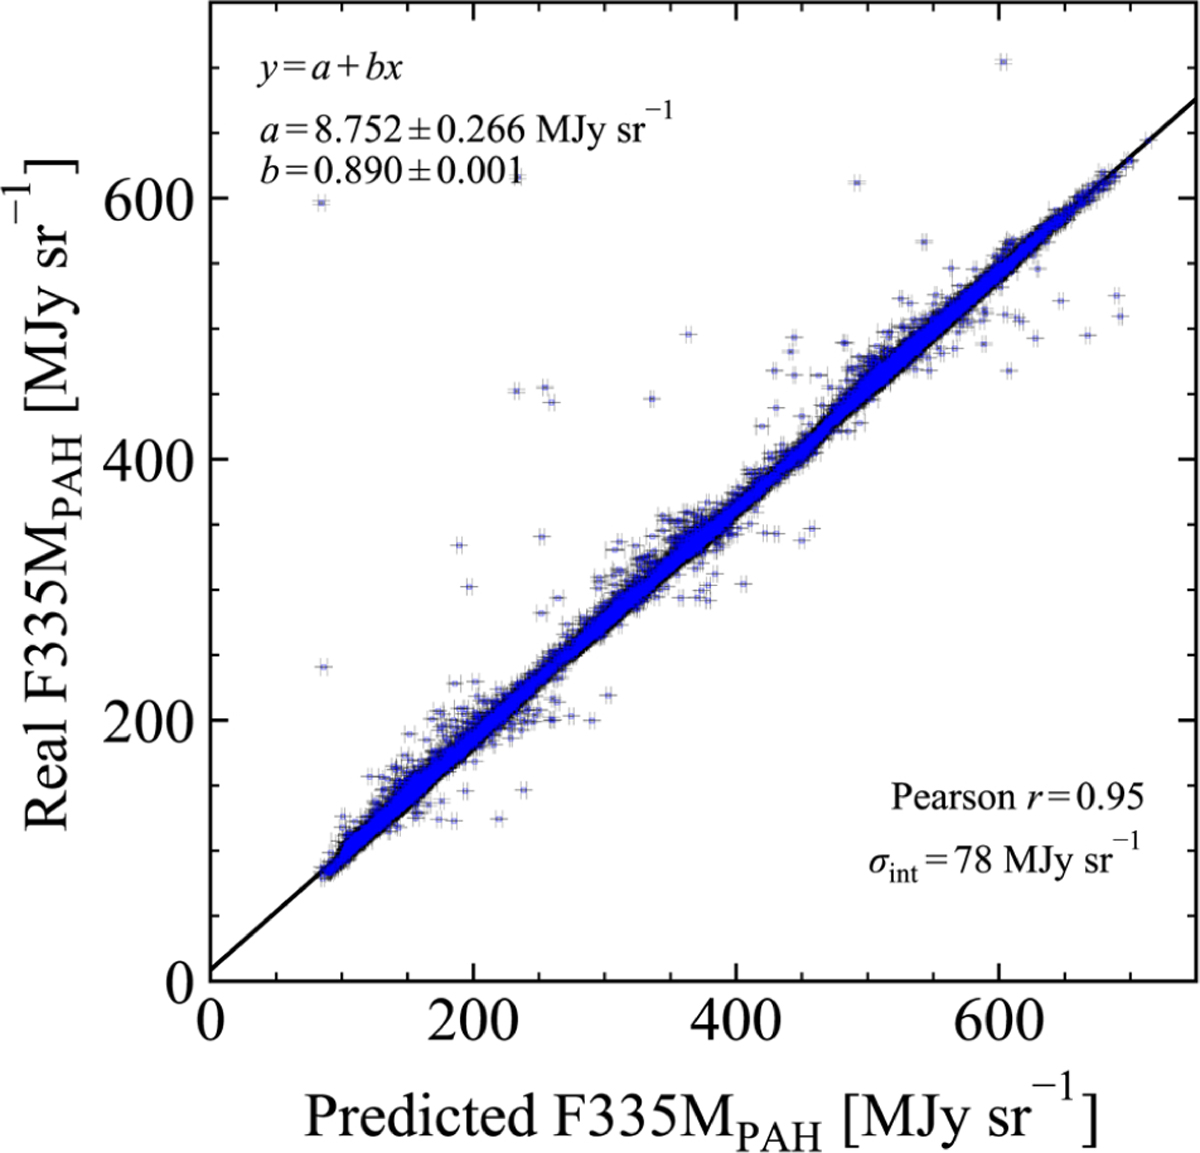
Comparison of the 3.3 μm PAH emission obtained following the procedure of Sandstrom et al. (2023) and Fig. 5 with the synthetic 3.3 μm PAH emission captured by the F335M filter using the NIRSpec data for the Orion Bar. A linear fit is shown by the solid line and the fit parameters are given in the top left corner of the panel. The Pearson correlation coefficient r and intrinsic scatter σint are given in the lower right corner of the panel.
Current usage metrics show cumulative count of Article Views (full-text article views including HTML views, PDF and ePub downloads, according to the available data) and Abstracts Views on Vision4Press platform.
Data correspond to usage on the plateform after 2015. The current usage metrics is available 48-96 hours after online publication and is updated daily on week days.
Initial download of the metrics may take a while.