Fig. 5
Download original image
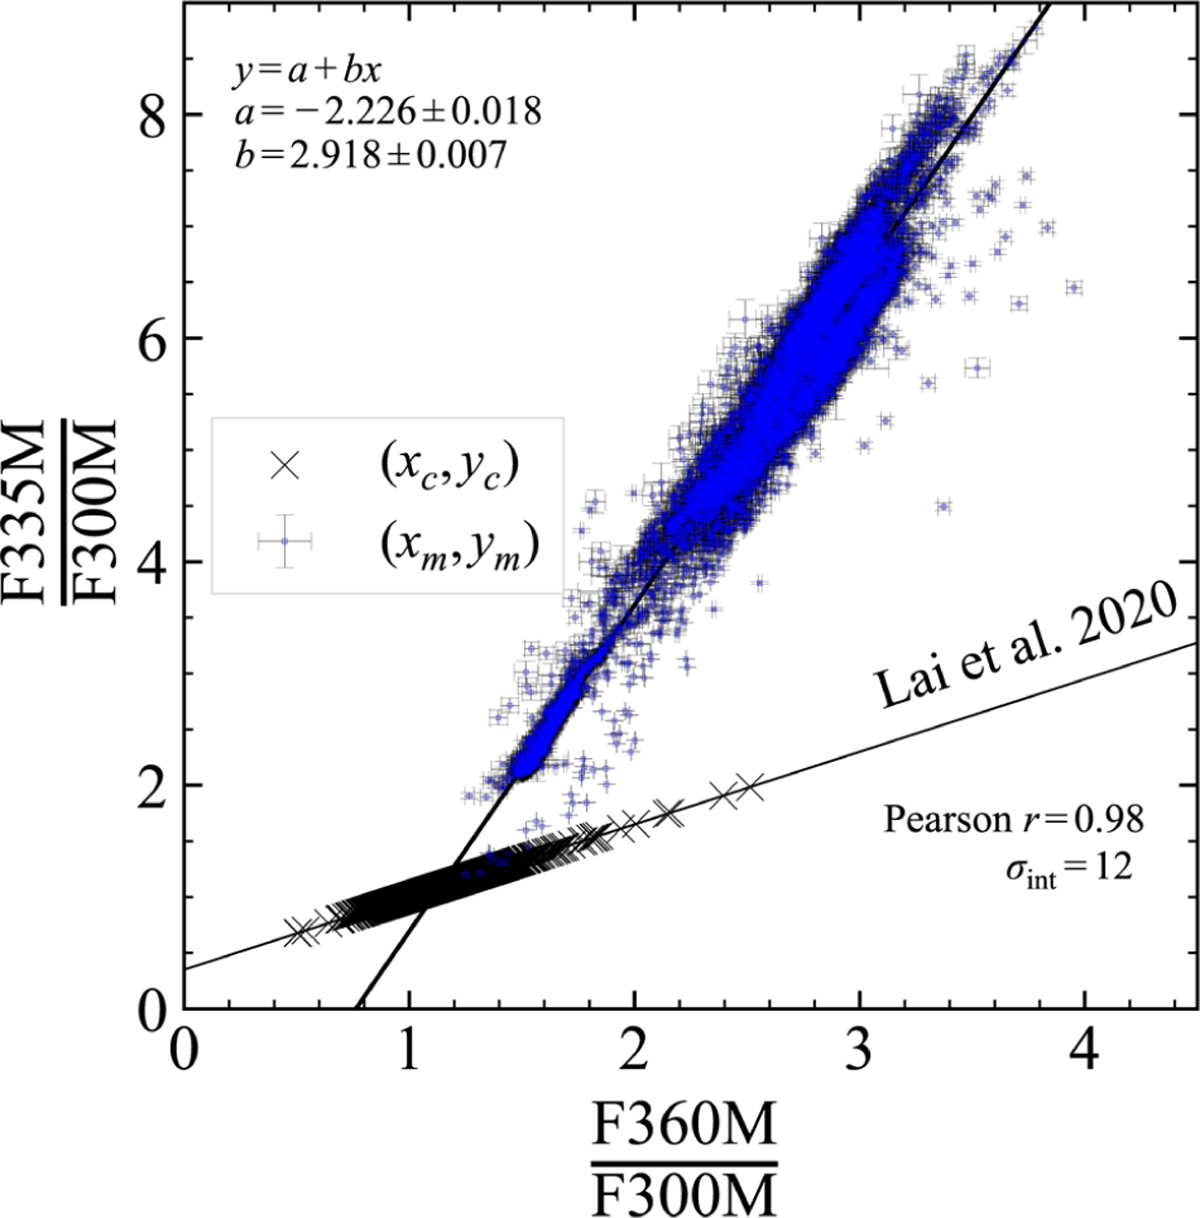
The F360M/F300M versus F335M/F300M relationship for the Orion Bar (blue points) and the galaxies of Lai et al. (2020) where the continuum is dominated by stellar emission (black crosses). A linear fit is shown for both the Orion Bar and the galaxy sample by the solid lines. Fit parameters for the Orion Bar are given in the top left corner of the panel whereas fit parameters for the galaxy sample are taken from Lai et al. (2020). The Pearson correlation coefficient r and intrinsic scatter σint for the Orion Bar are given in the lower right corner of the panel.
Current usage metrics show cumulative count of Article Views (full-text article views including HTML views, PDF and ePub downloads, according to the available data) and Abstracts Views on Vision4Press platform.
Data correspond to usage on the plateform after 2015. The current usage metrics is available 48-96 hours after online publication and is updated daily on week days.
Initial download of the metrics may take a while.