Fig. 4
Download original image
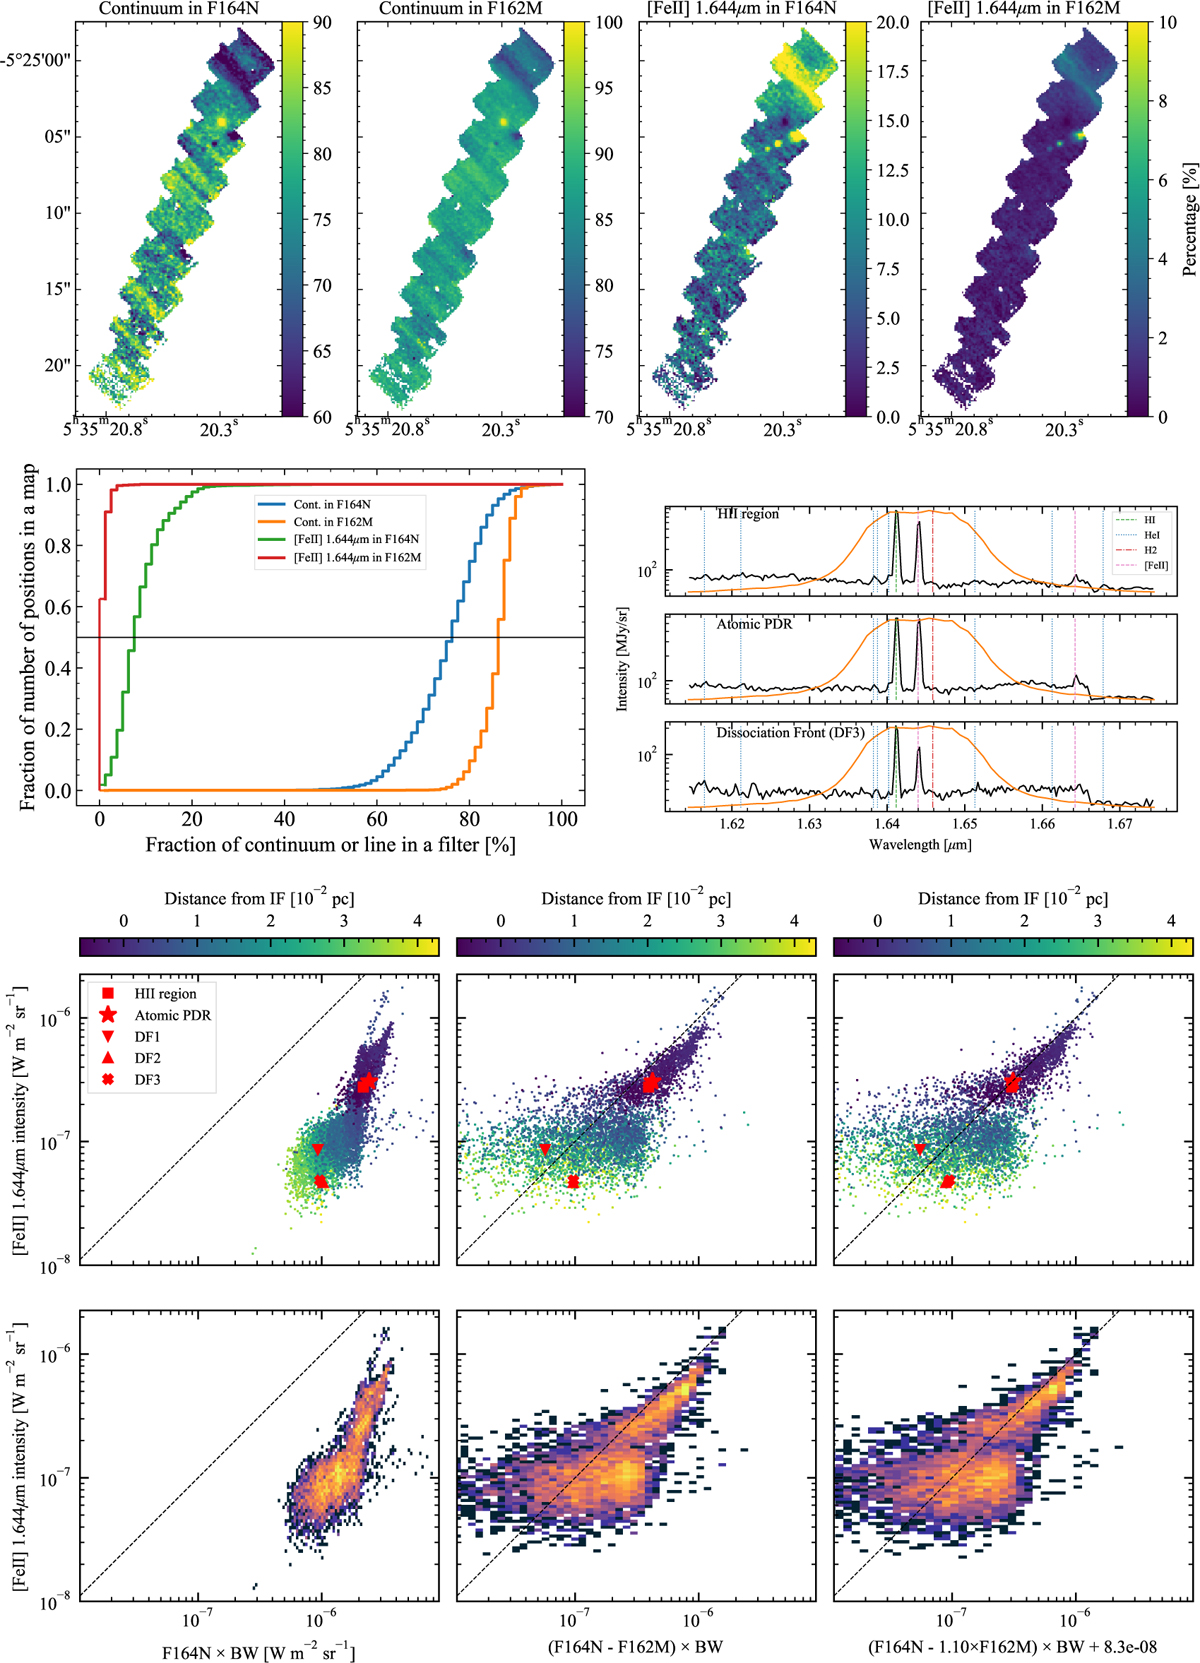
Analysis of the continuum and [Fe II] 1.64 μm emission in F164N and F162M calculated from the NIRSpec spectra. Top: maps of the continuum fraction in F164N and F162M (left two panels) and the [Fe II] 1.64 μm fraction (right two panels). Middle left: cumulative histograms of the continuum and line fractions in the top panels. The black line indicates 50%, i.e., the median value. Middle right: three template spectra in the range covered by F164N. Response functions of the filters are shown with thin orange lines. Expected positions of H I, He I, and H2, and [Fe II] lines are marked. Bottom: correlation between the synthetic images (left: F164N, middle: F164N–F162M, right: the best fit with Eq. (5)) and the measured [Fe II] 1.64 μm line intensities. x-axis is the surface brightness of the synthetic images multiplied by the band width (BW) of F164N (see main text). The second last row shows the correlations color coded by the distance of each pixel from the ionization front (IF; see Peeters et al. 2024), while the bottom row shows two-dimensional histograms color coded by the density of pixels. Only pixels detected at 3σ or higher are shown. The black line indicates the 1:1 relationship, i.e., perfect agreement between the x and y axes. Red points show measurements from the five template spectra. See Sect. 4.3.1 for details. Additional correlation plots for all other emission lines, PAH features, and continuum measurements are presented in Appendix C.
Current usage metrics show cumulative count of Article Views (full-text article views including HTML views, PDF and ePub downloads, according to the available data) and Abstracts Views on Vision4Press platform.
Data correspond to usage on the plateform after 2015. The current usage metrics is available 48-96 hours after online publication and is updated daily on week days.
Initial download of the metrics may take a while.