Fig. 3
Download original image
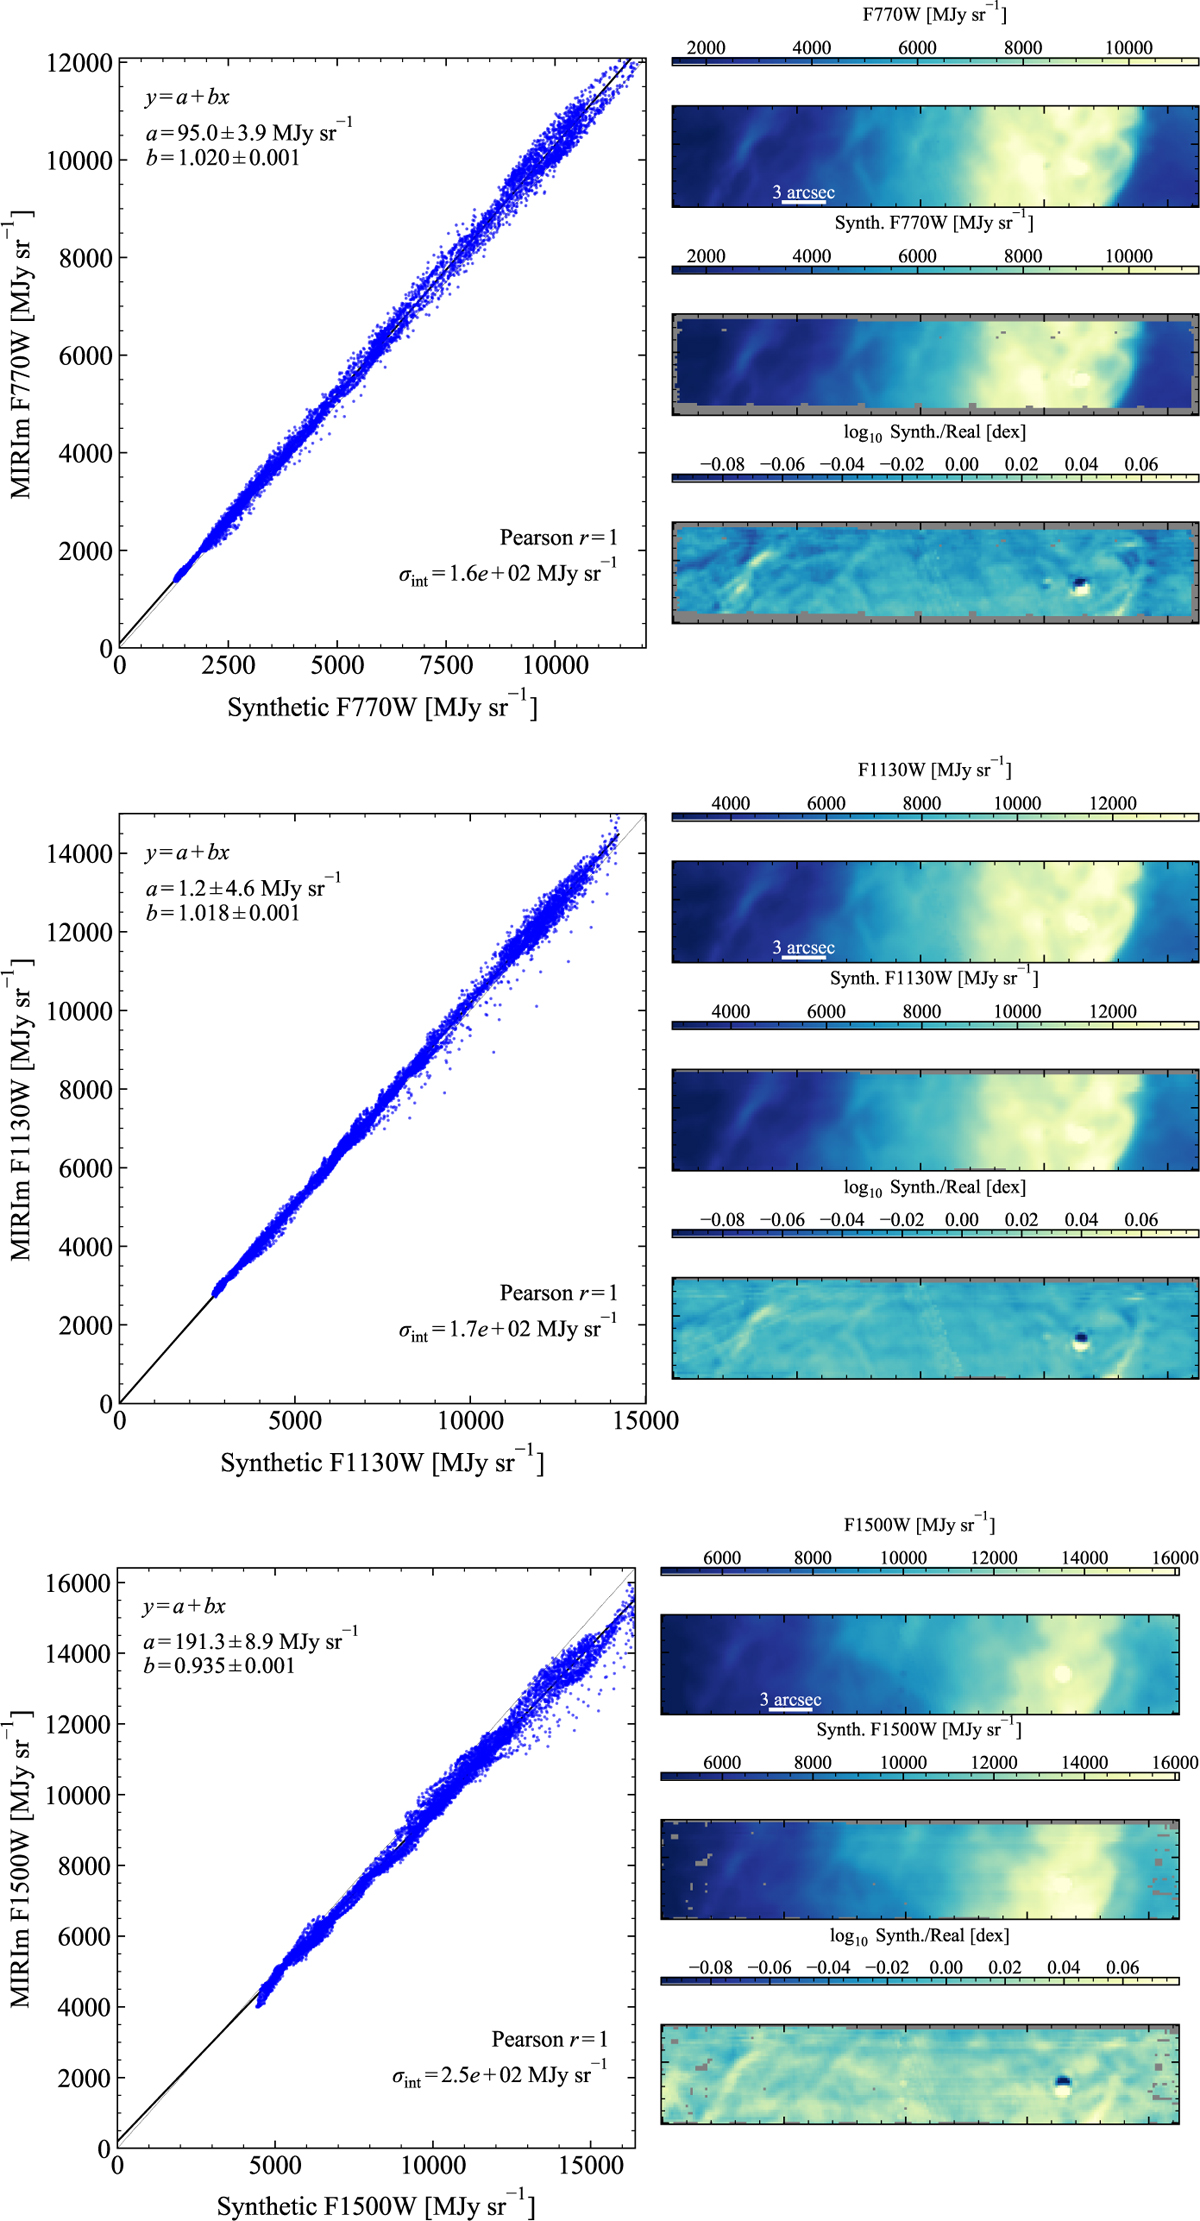
MIRI MRS/MIRI Imager cross-calibration results for MIRI filters: F770W (top), F1130W (middle), and F1500W (bottom). For each filter, the three images on the right (top to bottom) are a MIRI image zoomed in on the MRS FoV, a synthetic image measured from the stitched, scaled MRS cube, and the ratio of the synthetic image to the real image. The left panels show the linear fit of fluxes from individual pixels from the real MIRI image (y-axis) and synthetic MIRI image (x-axis). The best-fit parameters are given in Table 2. The thin dotted line is a 1:1 relationship. The shadow-like features in the ratio maps are largely due to residual (but expected) astrometric offsets between the imaging and IFU observations.
Current usage metrics show cumulative count of Article Views (full-text article views including HTML views, PDF and ePub downloads, according to the available data) and Abstracts Views on Vision4Press platform.
Data correspond to usage on the plateform after 2015. The current usage metrics is available 48-96 hours after online publication and is updated daily on week days.
Initial download of the metrics may take a while.