Fig. C.12
Download original image
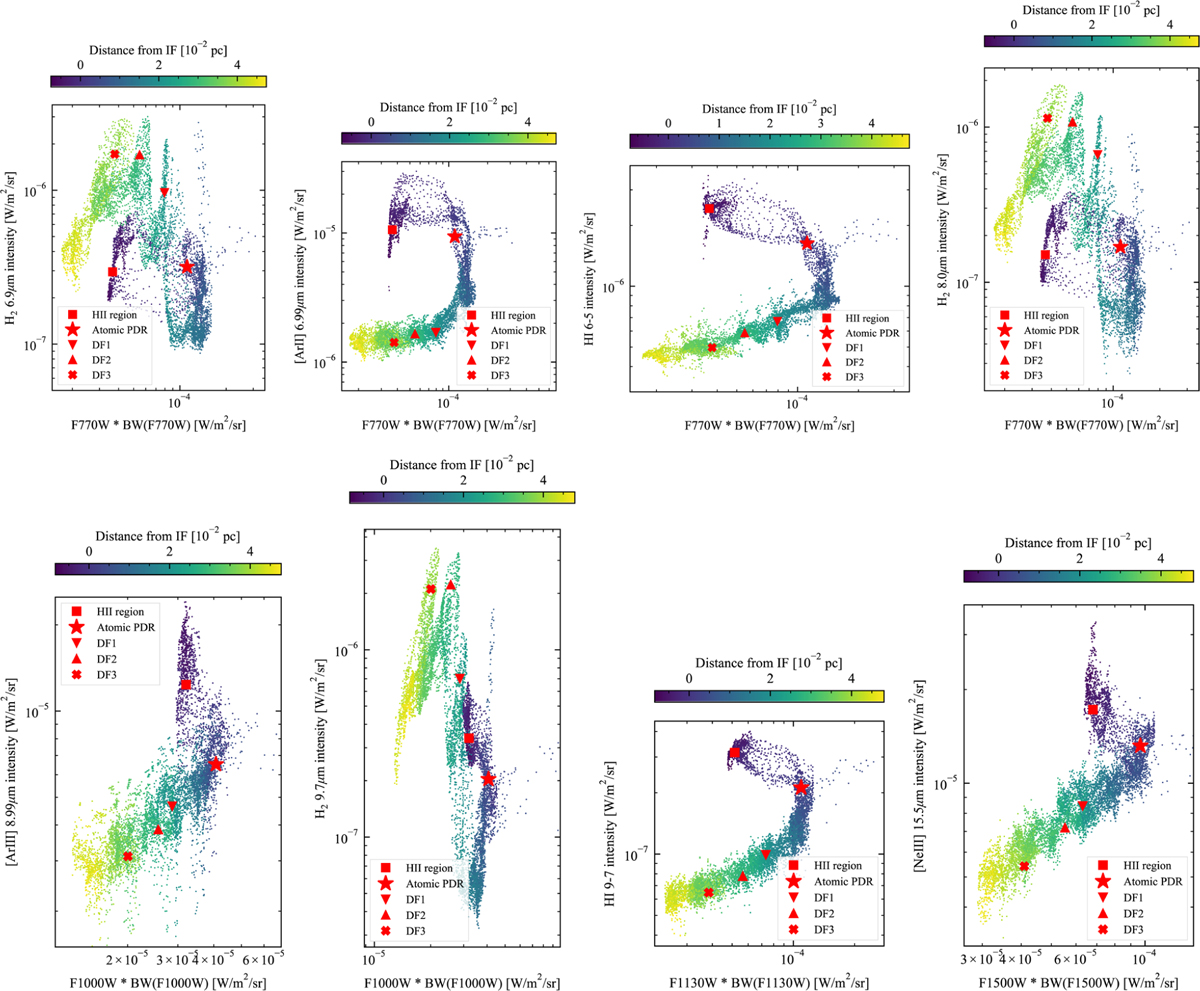
Correlation between the measured line intensities and the synthetic images of the MIRI filters. Top from left to right: H2 6.9 μm and F770W, [Ar II] 6.99 μm and F770W, HI 6–5 and F770W, and H2 8.0 μm and F770W. Bottom from left to right: [Ar III] 8.99 μm and F770W, H2 9.7 μm and F1000W, HI 9–7 and F1130W, and [Ne III] 15.5 μm and F1500W. We do not include the [S IV] 10.5 μm here due to the unsolved artifacts likely due to spurious jump detections in the ramps. Colors indicate the distance from the ionization front as in Fig. 4. Red marks indicate the data points of the five template spectra.
Current usage metrics show cumulative count of Article Views (full-text article views including HTML views, PDF and ePub downloads, according to the available data) and Abstracts Views on Vision4Press platform.
Data correspond to usage on the plateform after 2015. The current usage metrics is available 48-96 hours after online publication and is updated daily on week days.
Initial download of the metrics may take a while.